Copyright
©2007 Baishideng Publishing Group Co.
World J Gastroenterol. May 28, 2007; 13(20): 2862-2866
Published online May 28, 2007. doi: 10.3748/wjg.v13.i20.2862
Published online May 28, 2007. doi: 10.3748/wjg.v13.i20.2862
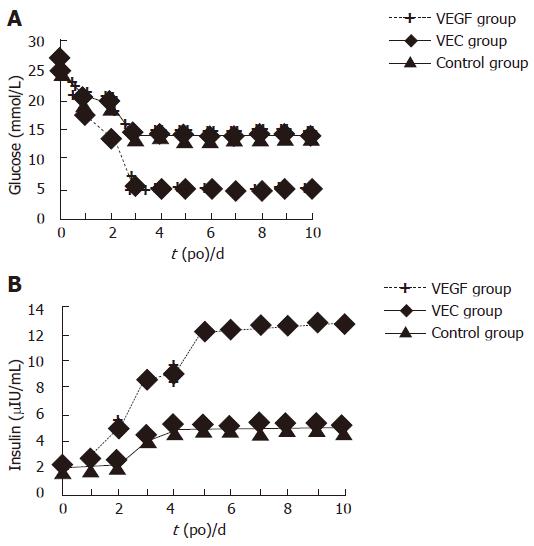
Figure 1 Glucose (A) and insulin (B) levels in the diabetic rats after transplantation.
Figure 2 HE staining of the graft islets under the kidney capsule (× 400).
A: Control group; B: VEC group; C: VEGF group.
Figure 3 Immunohistochemical staining of insulin-6 in graft islets transplanted under the kidney capsule (× 400).
A: Control group; B: VEC group; C: VEGF group.
Figure 4 Immunohistochemical staining of VEGF in graft islets transplanted under the kidney capsule (× 400).
A: Control group; B: VEC group; C: VEGF group.
Figure 5 Immunohistochemical staining of CD34 in graft islets transplanted under the kidney capsule (× 400).
A: Control group; B: VEC group; C: VEGF group.
- Citation: Cheng Y, Liu YF, Zhang JL, Li TM, Zhao N. Elevation of vascular endothelial growth factor production and its effect on revascularization and function of graft islets in diabetic rats. World J Gastroenterol 2007; 13(20): 2862-2866
- URL: https://www.wjgnet.com/1007-9327/full/v13/i20/2862.htm
- DOI: https://dx.doi.org/10.3748/wjg.v13.i20.2862


