Copyright
©2007 Baishideng Publishing Group Co.
World J Gastroenterol. May 28, 2007; 13(20): 2833-2840
Published online May 28, 2007. doi: 10.3748/wjg.v13.i20.2833
Published online May 28, 2007. doi: 10.3748/wjg.v13.i20.2833
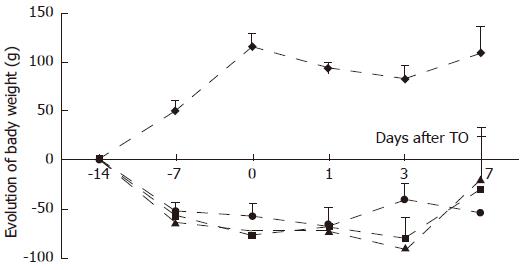
Figure 1 Evolution of body weight from initial weight as a function of time during the feeding period and at each time point studied after turpentine oil (TO) injection (arrow) for control (CG; ), protein-restricted (PR; ), glutamine (Gln; ) and protein-powder (PP; ) groups.
Values are means ± SD. P < 0.05, between CG and other groups from d-7 until d7.
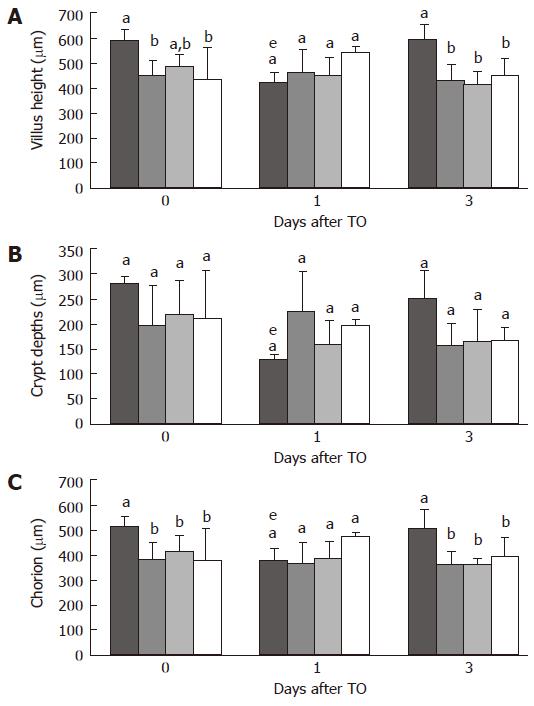
Figure 2 Morphometrics of jejunal villus height (A), jejunal crypt depths (B), and jejunal lamina propria (C), immediately before turpentine oil (TO) injection and 1, and 3 d after TO.
Rats received either control ( ), protein-restricted (PR; ), glutamine (Gln; ), or protein-powder (PP; ) supplemented diets. Values are means ± SD. Means without a common letter (a, b or c) differ. eP < 0.05 vs d 0.
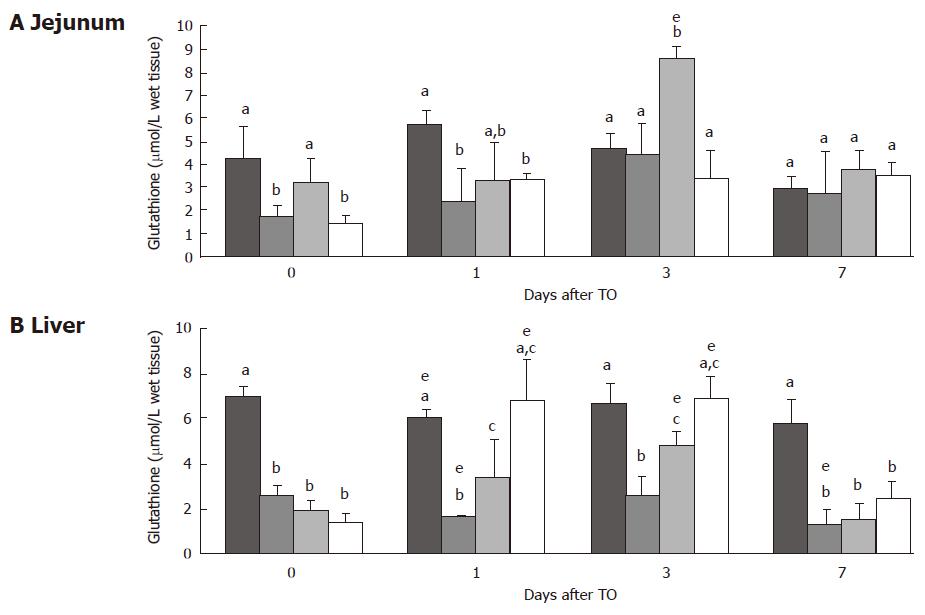
Figure 3 Jejunal (A) and liver (B) glutathione (μmol/g tissue) immediately before turpentine oil (TO) injection and 1, 3 and 7 d after TO.
Rats received either control ( ), protein-restricted (PR; ), glutamine (Gln; ), or protein-powder (PP; ). Values are means ± SD. Means without a common letter (a, b or c) differ. eP < 0.05 vs d 0.
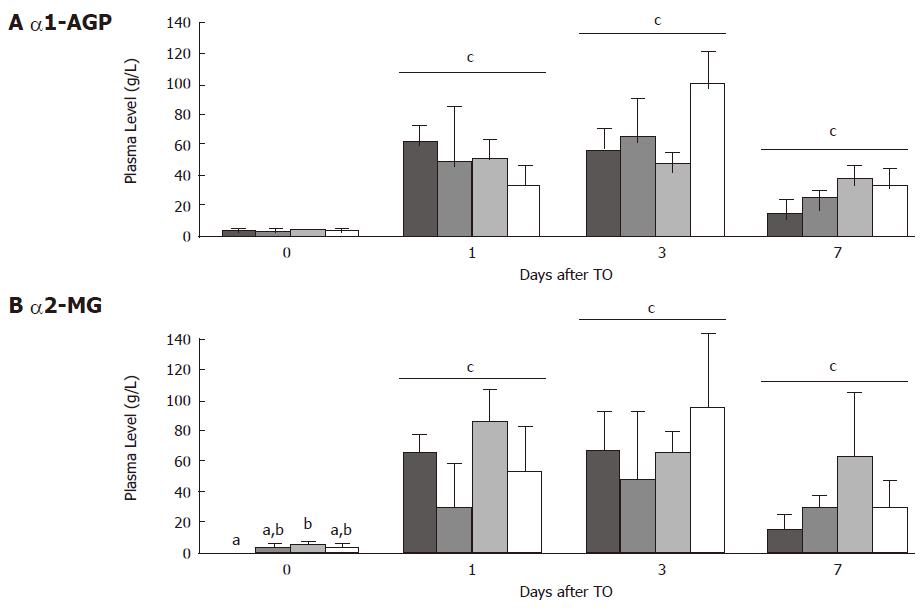
Figure 4 Plasma levels (g/L) for alpha-1 acid glycoprotein (A) and alpha-2 macroglobulin (B) immediately before turpentine oil (TO) injection and 1, 3 and 7 d after TO.
Rats received either control ( ), protein-restricted (PR; ), glutamine (Gln; ), or protein-powder (PP; ) supplemented diets. Values are means ± SD. Means without a common letter (a, b) differ. cP < 0.05 vs d 0.
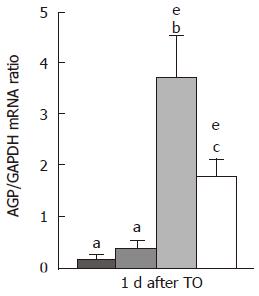
Figure 5 Jejunal mRNA level for alpha-1 acid glycoprotein (AGP/GAPDH mRNA ratio) one day after turpentine oil injection.
Rats received either control ( ), protein-restricted (PR; ), glutamine (Gln; ), or protein-powder (PP; ) supplemented diets. Values are means ± SD. Means without a common letter (a, b or c) differ. eP < 0.05 vs d 0.
- Citation: Belmonte L, Coëffier M, Pessot FL, Miralles-Barrachina O, Hiron M, Leplingard A, Lemeland JF, Hecketsweiler B, Daveau M, Ducrotté P, Déchelotte P. Effects of glutamine supplementation on gut barrier, glutathione content and acute phase response in malnourished rats during inflammatory shock. World J Gastroenterol 2007; 13(20): 2833-2840
- URL: https://www.wjgnet.com/1007-9327/full/v13/i20/2833.htm
- DOI: https://dx.doi.org/10.3748/wjg.v13.i20.2833


