Copyright
©2007 Baishideng Publishing Group Co.
World J Gastroenterol. Jan 14, 2007; 13(2): 192-218
Published online Jan 14, 2007. doi: 10.3748/wjg.v13.i2.192
Published online Jan 14, 2007. doi: 10.3748/wjg.v13.i2.192
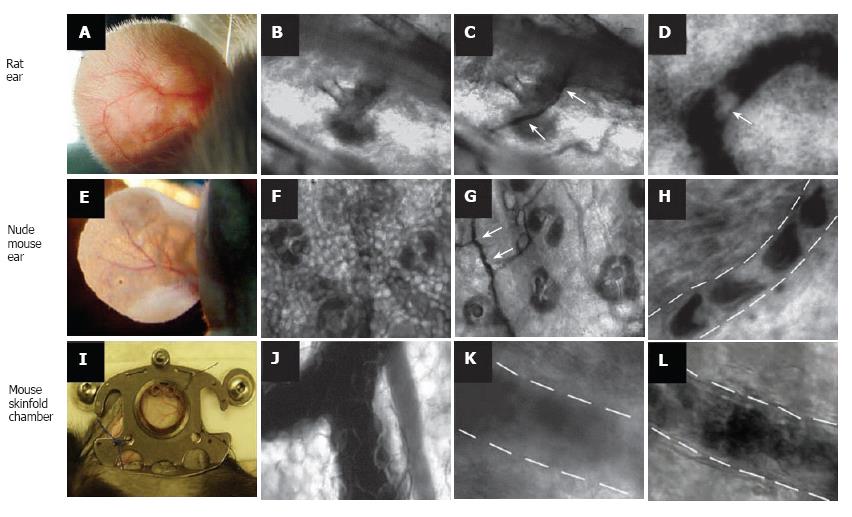
Figure 1 Label-free imaging of blood vessels in different animal models.
Rat ear (with hair): A: External view of large vessel; B, C: transmission images of microvessel at low magnification (4 ×) before (B) and after (C) topical administration of an optical clearing agent such as glycerol (arrows show microvessel); D: high-resolution image of rolling WBC (arrow) in a venula (magnification 40 ×). Ear of nude mouse: E: external view of large vessels; F, G: transmission images of microvessels at low magnification (10 ×) before (F) and after (G) topical administration of glycerol (arrows show microvessel); H: high-resolution image of individual RBCs in a capillary (magnification 100 ×); I: large vessels in skinfold chamber of a mouse; J: transmission image of blood microvessel at low magnification (10 ×); K, I: high-resolution image of a venula before (K) and after (I) topical administration of glycerol (40 ×).
Figure 2 Imaging of lymph vessels using contrast agents in different rat models.
Lymphatics labeled by a 1% solution of lymphazurin in muscles of (A) abdomen wall, (B) tongue, and (C) pad.
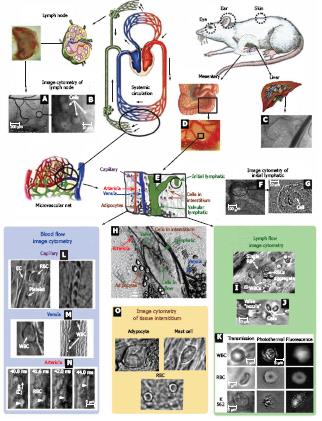
Figure 3 In vivo monitoring of microcirculation using rat mesentery.
A, B: Sections of a single lymph node at different magnifications (4 × and 100 ×, respectively); C: liver section (10 ×); D: section of intestine with mesentery; E: schematic of typical tissue microvascular unit; F, G: initial lymphatic (4 × and 100 ×); H: section of mesenteric tissue with valvular lymph vessel and surrounding blood vessels (10 ×); I: high-resolution imaging of single WBCs and RBCs, as well as their aggregates in lymph flow (100 ×); J: valve tip with fast-flowing cells (100 ×); K: transmission, photothermal, and fluorescence images of individual WBC, RBC, and K562 leukemic cell in lymph flow; L: capillary at different magnifications, (left) high-resolution images of RBCs, platelets, and endothelial cells (EC) in capillary wall (100 ×) and (right) parachute-like RBCs at low magnification (10 ×); M: rolling WBC in venula (100 ×, 10 ×); N: four sequential high-resolution images of RBC shapes in fast arteriolar flow (velocity of 5 mm/s; 40 ×); O: high-resolution images of adipocyte, mast cell, and RBCs in the interstitial space (100 ×).
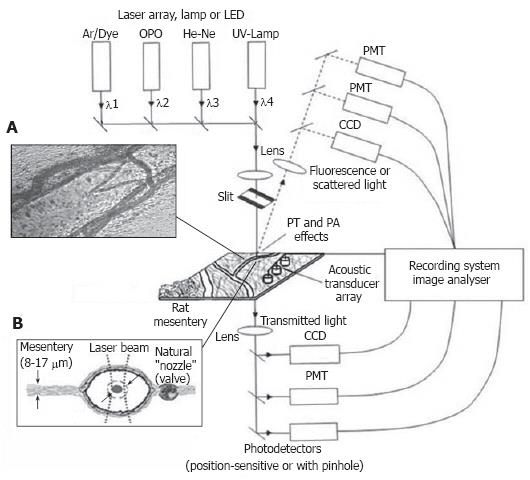
Figure 4 Integrated, multispectral FC in vivo.
A: Typical transmission image of rat mesentery segment with lymph and blood microvessels; B: Schematic of the mesentery cross-section.
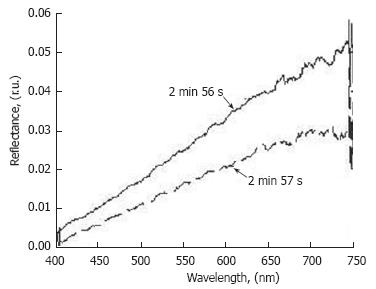
Figure 5 Time-resolved reflection spectra from the same point on the lymphatic vessel (D = 128 μm) at different times.
Figure 6 Typical positions of probe (red) and pump (green) laser beams during PT imaging.
A: Circular beams in a blood capillary (cell velocity, ~0.5 mm/s; magnification, 100 ×); B: Overlapping pump and probe pulses in an artery (cell velocity, ~2 mm/s; magnification, 10 ×); C: an ellipsoidal beam geometry in a blood vessel (cell velocity, ~5 mm/s; magnification, 10 ×).
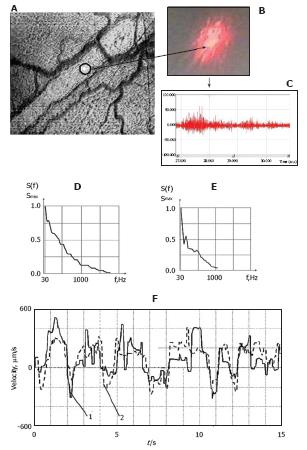
Figure 7 Integration of laser speckle and transmission microscopies for studying lymph flow dynamics.
A: A laser beam was focused into a small-diameter spot (~5 μm) on axial lymph flow (microvessel diameter 55 μm); B: Lymph flow randomly modulated the focused Gaussian beam to provide scattered dynamic speckles images; C: Scattered intensity fluctuations were detected by a photodetector and transformed into an electrical output signal. D and E: Spectral shapes from scanning the lymphatic cross-section: (D) the spectrum when the laser beam was focused in axial flow and (E) when the laser beam was focused in flow near the lymphatic wall; F: Real-time dynamics of lymph-flow velocity in a lymph microvessel, recorded with a laser speckle technique (curve 1) and by processing the video recording (curve 2).
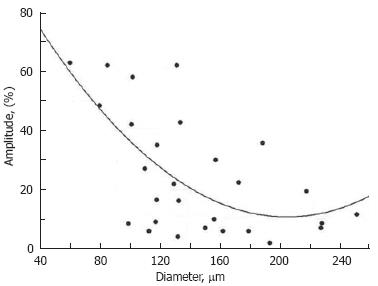
Figure 8 Diameter-amplitude relationship in rat mesenteric lymphangion.
Cycles- experimental data, solid curve-approximation (A = 109.3-0.96 × D + 0.0024 × D2, where A: amplitude and D: diameter).
Figure 9 Real-time dynamics of cell velocity in axial lymph flow within the non-valvular segment of a lymphangion (mean diameter of 170 ± 5 μm) without phasic contractions and valve activities, measured by processing the video recording (μm/s) for 15 s.
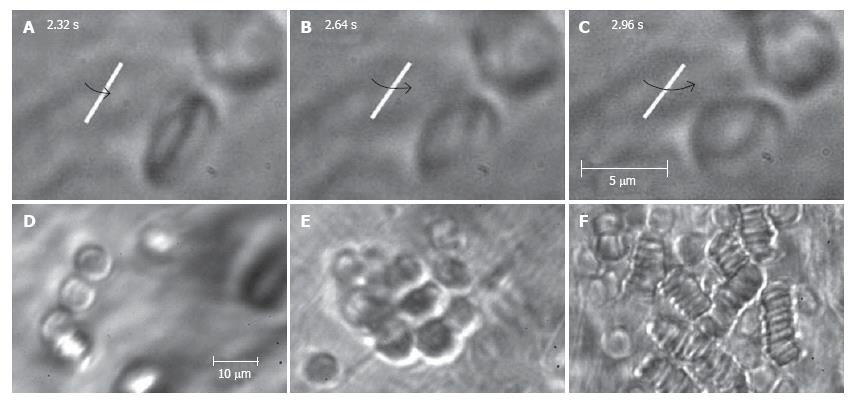
Figure 10 High-resolution monitoring of cell behavior in lymph flow.
Top row (A-C): three sequential images of an individual RBC’s rotation in lymph flow (lymphatic diameter 185 μm, mean cell velocity 220 μm/s, magnification 100 ×). Bottom row: moving aggregates of different sizes in lymph flow; D: Unstable aggregate of a few cells in intact lymphatic; E: large aggregate of RBCs in lymph flow resulting from venous insufficiency; F: rouleaux formation when numerous RBCs appeared in lymph flow due to laser-induced hemorrhage (magnification 100 ×).
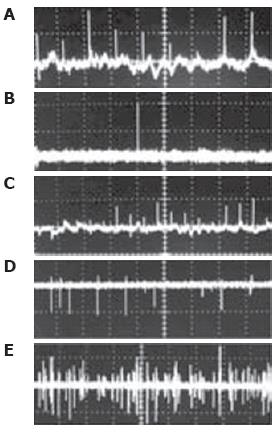
Figure 11 Typical PT-signal tracings from blood cells in blood and lymph flow: A: RBCs in blood flow; B: rare RBC in lymph flow; C: growing number of RBCs in lymph flow during laser-induced hemorrhage; D: laser-induced damage of RBCs in lymph flow and lymphocytes in lymph flow in linear and nonlinear PT modes; and E: lymphocytes and RBCs in lymph flow.
Laser parameters: wavelength, 525 nm; energy/amplitude/time scale/division: (A), 0.3 μJ/50 mV/100 ms; (B), 0.5 μJ/20 mV/1 s/div; (C) 0.6 μJ/100 mV/200 ms/div, (D) 5 μJ/500 mV/4 s/div; and (E) 145 μJ/100 mV/10 s, respectively.
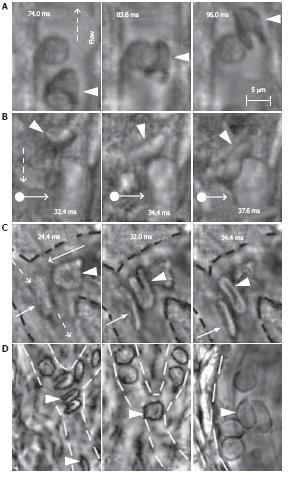
Figure 12 High-resolution, high-speed monitoring of cells in blood flow.
RBCs are indicated by conventional arrows and triangle; rolling WBCs by arrows originating from filled circles; and direction of flow by dashed lines. A-C: behavior of normal RBCs and WBCs in flow (1250-2500 fps; 40 ×); D: The shapes of normal (left) and diamide-treated (middle) RBCs in single-file flow of small venula (diameter ~10 μm), and (right) adhesion of diamide-treated RBCs to wall of the relatively large venula (diameter -40 μm).
Figure 13 The percentage of lymphangions exhibiting phasic contractions during 30 min of irradiation with a He-Ne laser (450 mW/cm2).
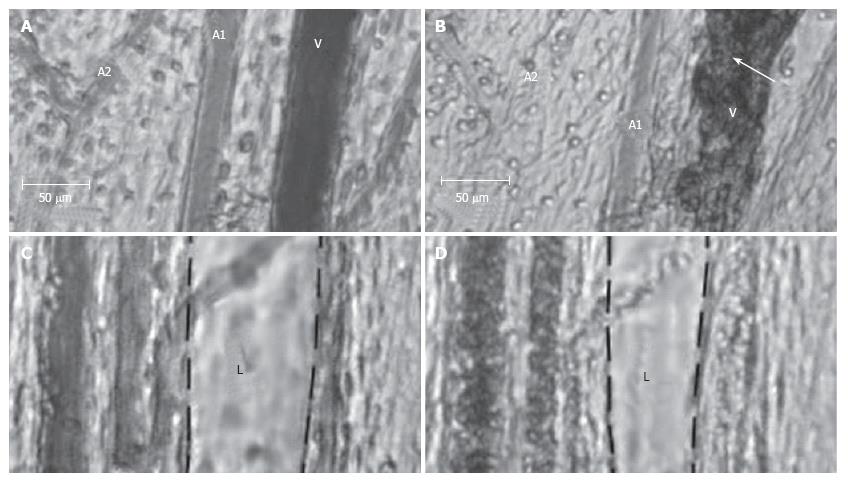
Figure 14 Effect of a laser pulse (585 nm, 10-ms pulse duration, 0.
5-30 J/cm2 radiant exposure) on blood and lymph microvessels in vivo. A: Intact venule (V) and arterioles (A1 and A2) with good blood flow; B: Damage to these microvessels immediately after laser pulse: local hemorrhage (arrow) around the venule (V) and stasis in a small arteriole (A2); C: Intact lymphatic (L) before laser pulse (black dash line shows internal margin of lymphatic wall); D: Laser-induced constriction of the lymphatic, which coincided with stasis in neighboring venules.
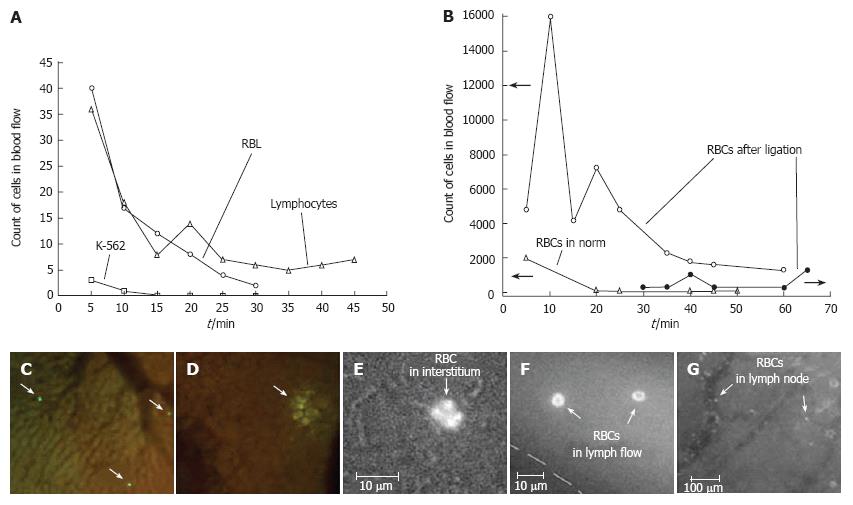
Figure 15 A: Monitoring of labeled rat lymphocytes, and rat (RBL) and human (K562) leukemia cells in blood vessels of rat mesentery; B: Simultaneous monitoring of RBCs in blood and lymph systems under normal conditions and with venous insufficiency; C, D: In vivo imaging of liver with (C) lymphocytes and (D) RBL leukemia cells.
Monitoring RBC migration from blood vessel (E) through interstitium to (F) lymph vessel and (G) lymph node.
Figure 16 A: Apoptotic (arrowhead, red) and normal (two arrow triangles, green) cells in two blood vessels (dashed lines); B: Apoptotic cells (arrowhead, red) in interstitium (arrow shows one vessel); C: Normal (arrow, green) and apoptotic (red) cells in a lymph node (dashed line).
Figure 17 ICG IR blood and lymph microangiography.
Transmission image before ICG injection (venula: short arrow, arteriola: triangle, lymph microvessel: long arrow) (A). Fluorescence images (excitation 805 nm; emission 830 nm) at the (B) 15th and (C) 45th min after ICG injection.
-
Citation: Galanzha EI, Tuchin VV, Zharov VP. Advances in small animal mesentery models for
in vivo flow cytometry, dynamic microscopy, and drug screening. World J Gastroenterol 2007; 13(2): 192-218 - URL: https://www.wjgnet.com/1007-9327/full/v13/i2/192.htm
- DOI: https://dx.doi.org/10.3748/wjg.v13.i2.192


