Copyright
©2007 Baishideng Publishing Group Co.
World J Gastroenterol. Jan 14, 2007; 13(2): 192-218
Published online Jan 14, 2007. doi: 10.3748/wjg.v13.i2.192
Published online Jan 14, 2007. doi: 10.3748/wjg.v13.i2.192
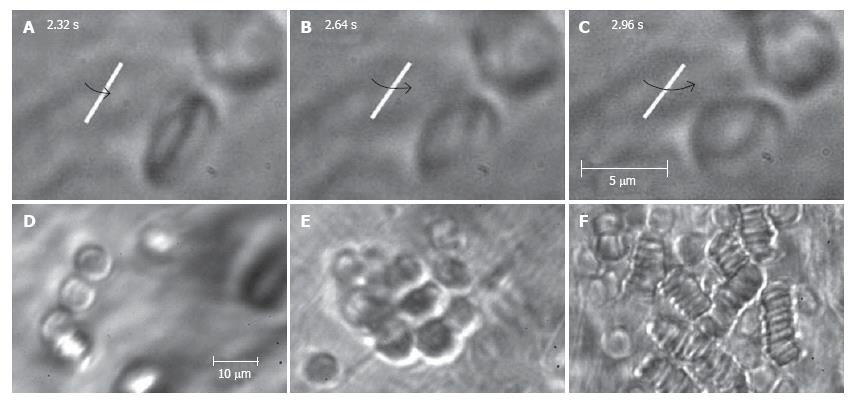
Figure 10 High-resolution monitoring of cell behavior in lymph flow.
Top row (A-C): three sequential images of an individual RBC’s rotation in lymph flow (lymphatic diameter 185 μm, mean cell velocity 220 μm/s, magnification 100 ×). Bottom row: moving aggregates of different sizes in lymph flow; D: Unstable aggregate of a few cells in intact lymphatic; E: large aggregate of RBCs in lymph flow resulting from venous insufficiency; F: rouleaux formation when numerous RBCs appeared in lymph flow due to laser-induced hemorrhage (magnification 100 ×).
-
Citation: Galanzha EI, Tuchin VV, Zharov VP. Advances in small animal mesentery models for
in vivo flow cytometry, dynamic microscopy, and drug screening. World J Gastroenterol 2007; 13(2): 192-218 - URL: https://www.wjgnet.com/1007-9327/full/v13/i2/192.htm
- DOI: https://dx.doi.org/10.3748/wjg.v13.i2.192


