Copyright
©2007 Baishideng Publishing Group Co.
World J Gastroenterol. May 21, 2007; 13(19): 2752-2755
Published online May 21, 2007. doi: 10.3748/wjg.v13.i19.2752
Published online May 21, 2007. doi: 10.3748/wjg.v13.i19.2752
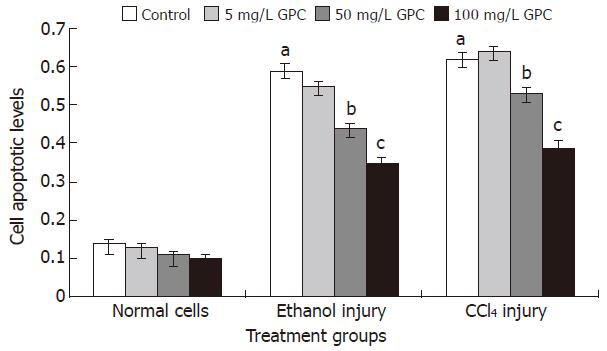
Figure 1 Cell apoptotic levels of each group.
Cells receiving various treatments were incubated for 24 h before apoptosis was detected using cell death detection ELISA. aP < 0.05 vs the normal control; cP < 0.05 vs the control and 5 mg/L GPC treatment group; eP < 0.05 vs the 50mg/L GPC treatment group.
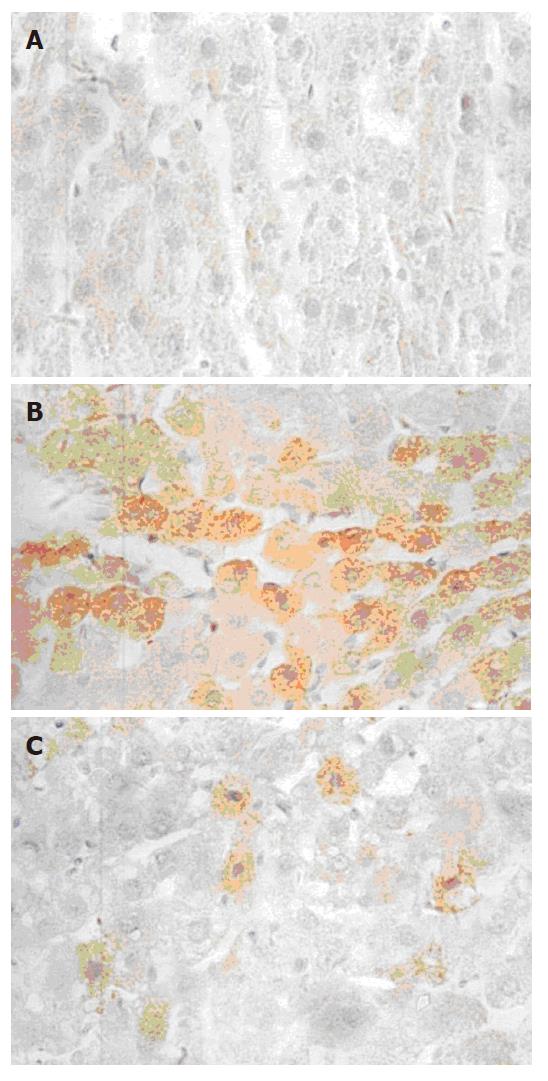
Figure 2 Microscopic TNFα mRNA expression (× 40).
Rat hepatocytes with various treatments were incubated for 24 h before TNFα mRNA expression was detected by in situ hybridization. Under light microscopy, TNFα mRNA was expressed as brown granules in cytoplasm. A: normal control; B: ethanol/CCl4 injury; C: 100 mg/L GPC + ethanol/CCl4.
-
Citation: Zhong JY, Cong HQ, Zhang LH. Inhibitory effects of grape procyanidins on free radical-induced cell damage in rat hepatocytes
in vitro . World J Gastroenterol 2007; 13(19): 2752-2755 - URL: https://www.wjgnet.com/1007-9327/full/v13/i19/2752.htm
- DOI: https://dx.doi.org/10.3748/wjg.v13.i19.2752


