Copyright
©2007 Baishideng Publishing Group Co.
World J Gastroenterol. May 21, 2007; 13(19): 2717-2721
Published online May 21, 2007. doi: 10.3748/wjg.v13.i19.2717
Published online May 21, 2007. doi: 10.3748/wjg.v13.i19.2717
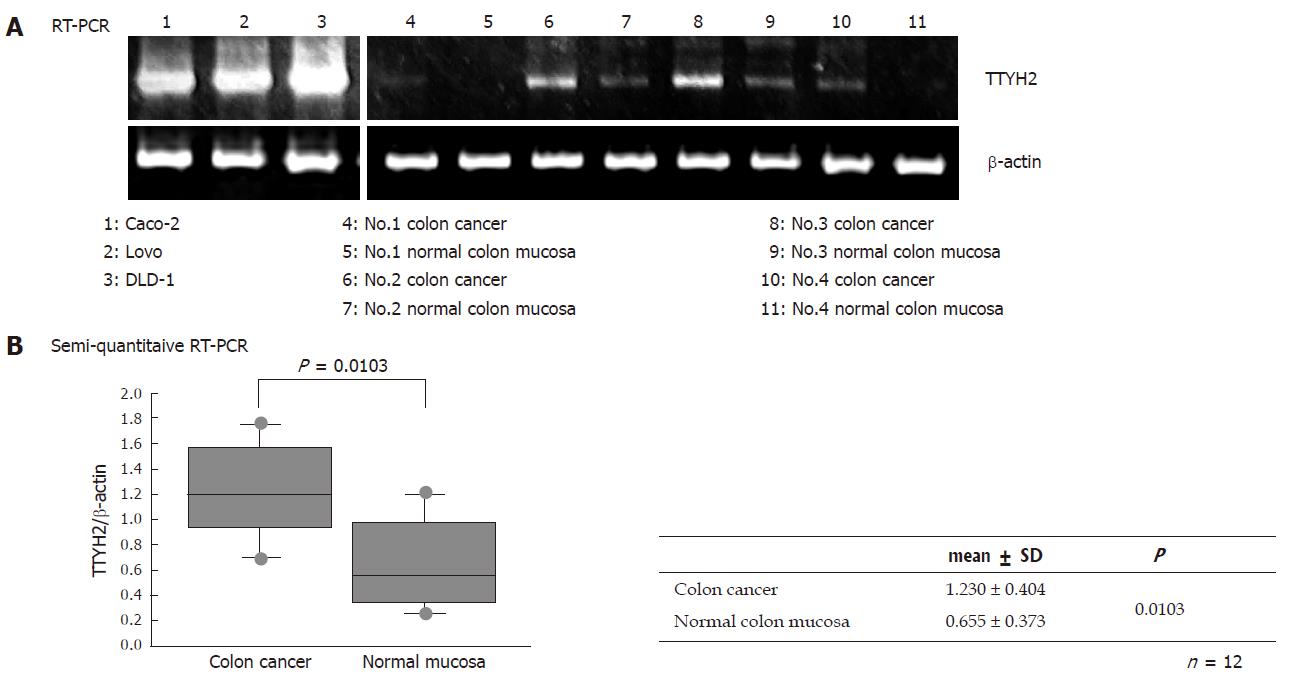
Figure 1 RT-PCR analysis of TTYH2 gene expression in colon cancer cell lines (Caco-2, DLD-1, Lovo), colon cancer tissues, and normal colonic mucosa.
A: RT-PCR was performed on four paired colon cancer and distant normal colonic mucosa specimens, as well as three colon cancer cell lines. β-actin was used as a control for cDNA synthesis; B: Semi-quantification of TTYH2 gene expression (TTYH2/β-actin) was performed in twelve paired colon cancer tissue and normal colonic mucosa specimens using NIH imaging software.
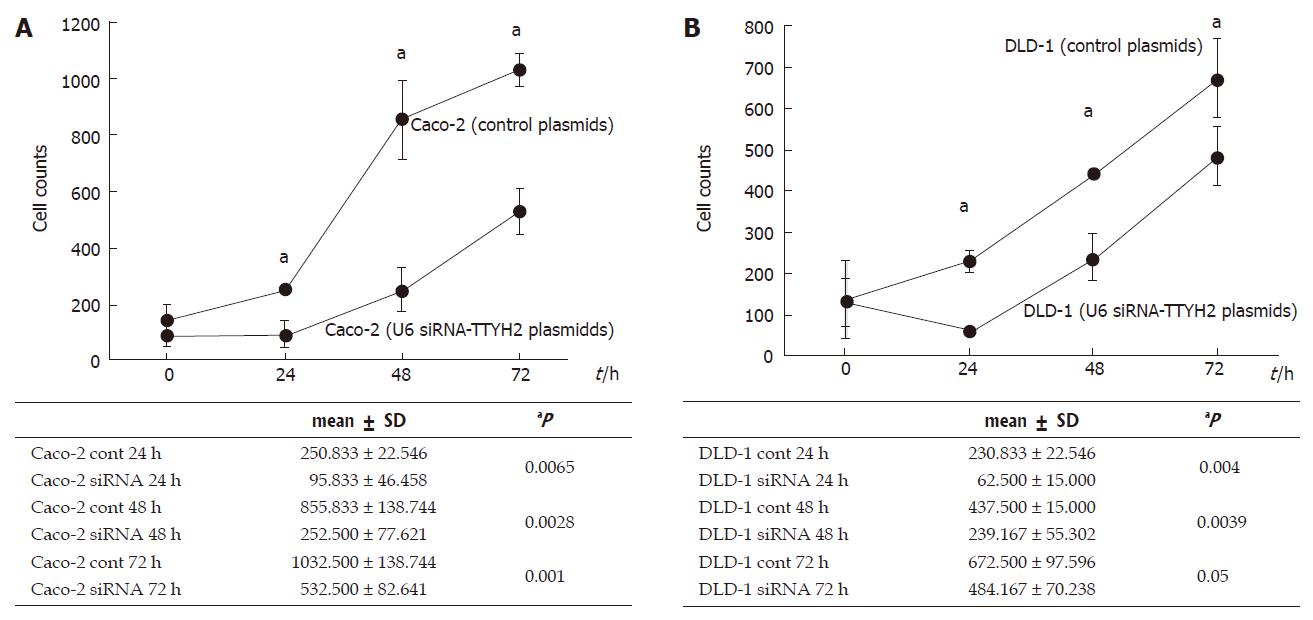
Figure 2 Growth kinetics of colon cancer cell lines (A: Caco-2, B: DLD-1) (U6 siRNA-TTYH2 plasmids) compared with control cell lines (control plasmids).
Growth curve plotted for cell number versus time of incubation (0 h, 24 h, 48 h and 72 h) of colon cancer cell line in vitro. The date indicated the mean ± SD of the experiments carried out in triplicate. aP < 0.05 vs control.
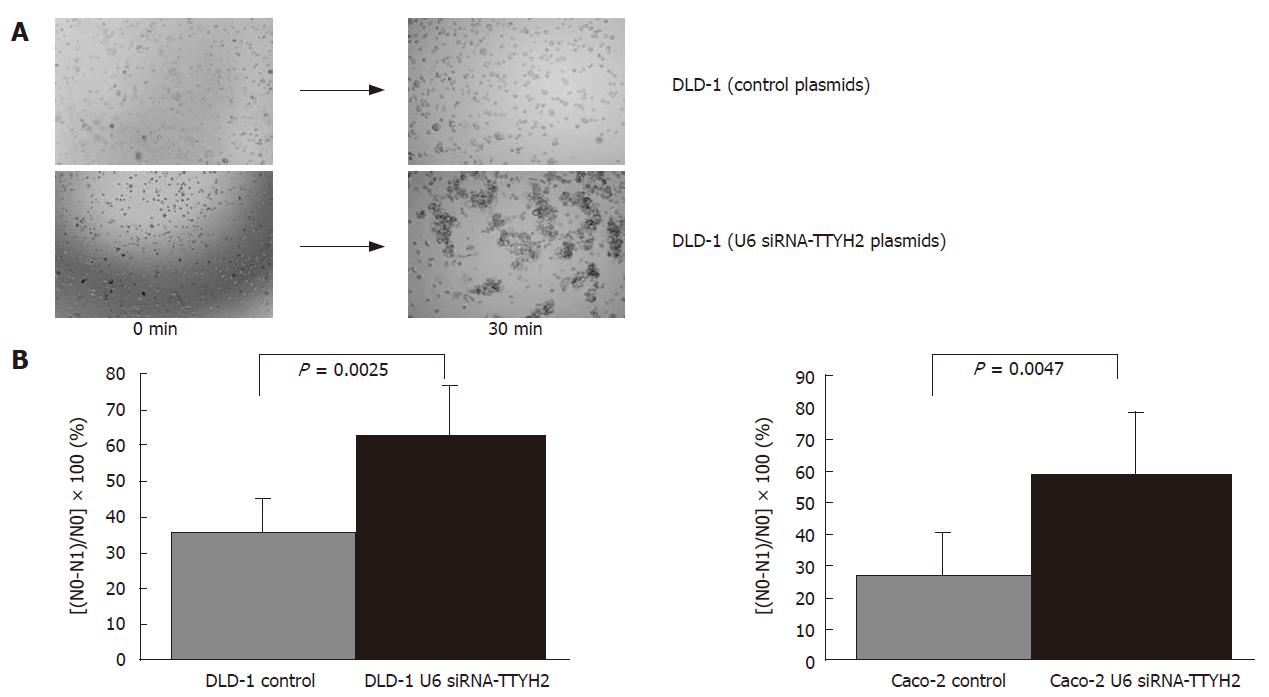
Figure 3 A: Multiple fields were photographed at 0 min and 30 min.
Pictures were taken at 10 × magnification and are representative of four experiments performed in triplicate. DLD-1 (U6 siRNA-TTYH2 plasmids) (lower panel) show increased cell-cell aggregation compared with control cells (upper panel); B: The rate of aggregation potential was calculated as the percentage of the number of single cells in a microscope field using the formula [(No - N1)/No] × 100, where No is the total number of cells and N1 is the number of single cells detected in the cultures at the different incubation times. The data represent the means ± SD of four experiments.
-
Citation: Toiyama Y, Mizoguchi A, Kimura K, Hiro J, Inoue Y, Tutumi T, Miki C, Kusunoki M. TTYH2, a human homologue of the
Drosophila melanogaster gene tweety, is up-regulated in colon carcinoma and involved in cell proliferation and cell aggregation. World J Gastroenterol 2007; 13(19): 2717-2721 - URL: https://www.wjgnet.com/1007-9327/full/v13/i19/2717.htm
- DOI: https://dx.doi.org/10.3748/wjg.v13.i19.2717


