Copyright
©2007 Baishideng Publishing Group Co.
World J Gastroenterol. Apr 28, 2007; 13(16): 2324-2327
Published online Apr 28, 2007. doi: 10.3748/wjg.v13.i16.2324
Published online Apr 28, 2007. doi: 10.3748/wjg.v13.i16.2324
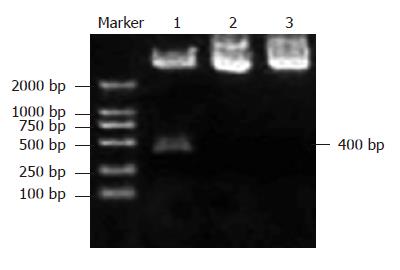
Figure 1 Electrophoresis analysis of digestion using SalI/PstI.
Lane 1: psil-HBV/SalI; lane 2: psil-HBV/PstI; lane 3: psil-HBV.
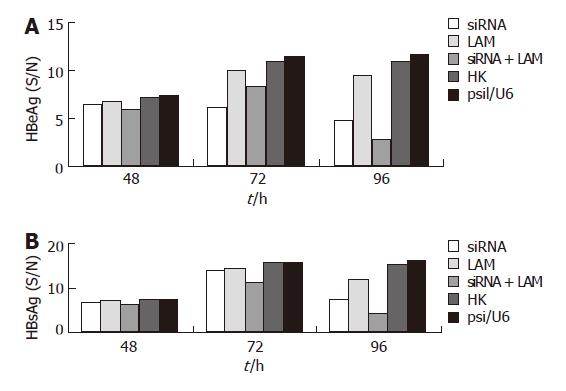
Figure 2 Decrease in the concentration of HBeAg and HBsAg in HepG2.
2.15 cells. A: Reduction of HBeAg level; B: Reduction of HBsAg level (S/N: sample to negative ratio).
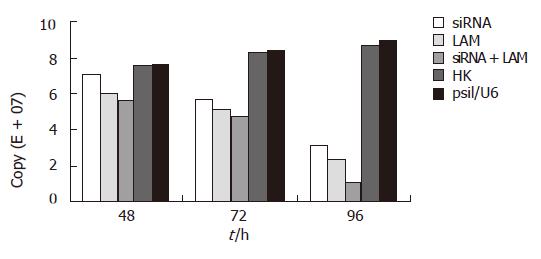
Figure 3 Inhibition of HBV DNA replication in HepG2.
2.15 cells.
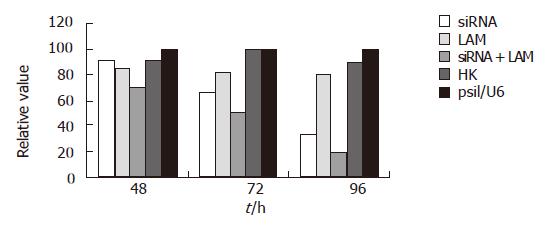
Figure 4 Reduction of mRNA level in HepG2.
2.15 cells.
- Citation: Li GQ, Xu WZ, Wang JX, Deng WW, Li D, Gu HX. Combination of small interfering RNA and lamivudine on inhibition of human B virus replication in HepG2.2.15 cells. World J Gastroenterol 2007; 13(16): 2324-2327
- URL: https://www.wjgnet.com/1007-9327/full/v13/i16/2324.htm
- DOI: https://dx.doi.org/10.3748/wjg.v13.i16.2324


