Copyright
©2007 Baishideng Publishing Group Co.
World J Gastroenterol. Apr 7, 2007; 13(13): 1989-1994
Published online Apr 7, 2007. doi: 10.3748/wjg.v13.i13.1989
Published online Apr 7, 2007. doi: 10.3748/wjg.v13.i13.1989
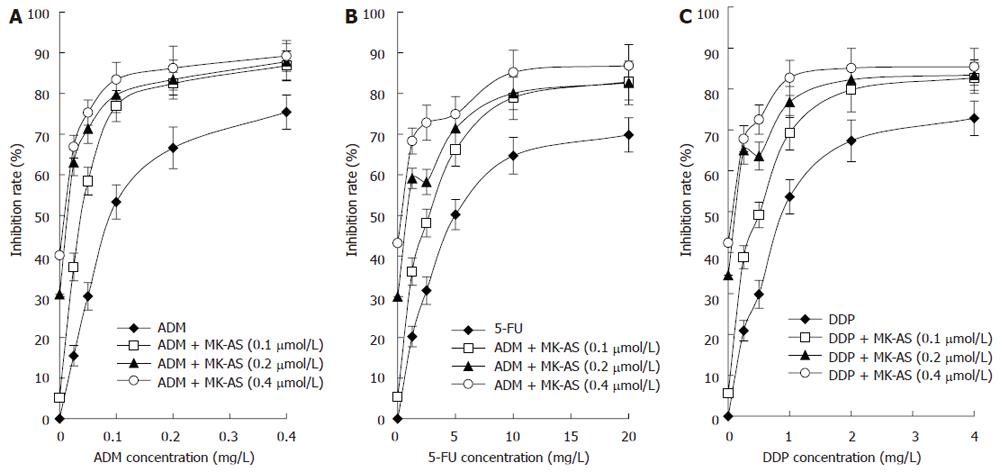
Figure 1 Analysis of combined effect of MK-AS and ADM (A), 5-FU (B) and DDP (C) in HepG2 cells.
Each value represents the mean ± SD from triplicate determinations.
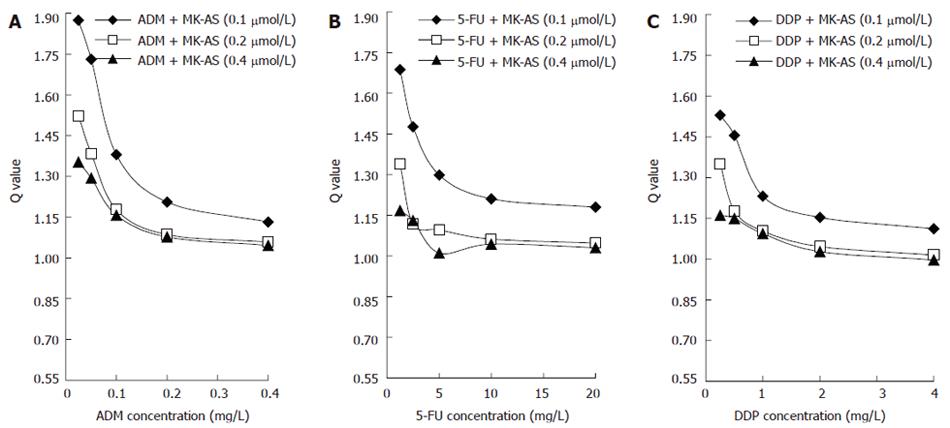
Figure 2 Q values for combined treatment of MK-AS and ADM (A), 5- FU (B) and DDP (C) in HepG2 cells.
Q values were calculated from the dose-response curves shown in Figure 1 and analyzed by Zheng-Jun Jin’s method.
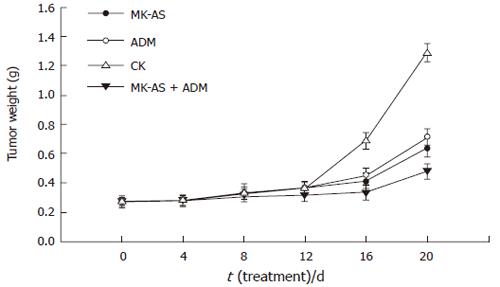
Figure 3 Tumor growth in situ human HCC model after treatment with MK-AS and/or ADM.
CK: Treatment with saline; ADM: Treatment with ADM; MK-AS: Treatment with MK-AS; ADM + MK-AS: Combination of ADM with MK-AS. Each value represents the mean ± SD from 7 determinations.
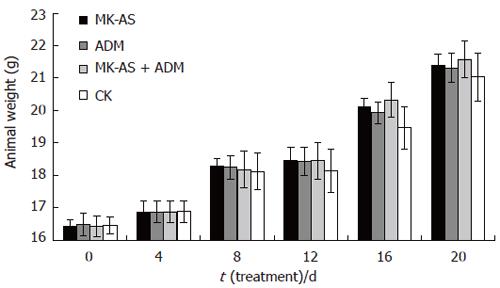
Figure 4 The human HCC model animal weight after treatment with MK-AS and/or ADM.
CK: Treatment with saline; ADM: Treatment with ADM; MK-AS: Treatment with MK-AS; ADM + MK-AS: Combination of ADM with MK-AS. Each value represents the mean ± SD from 7 determinations.
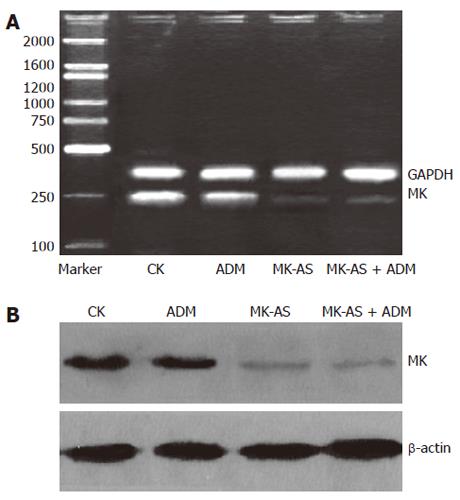
Figure 5 Effects of MK-AS and ADM on MK expression in in situ human hepatocellular carcinoma (HCC) model.
A: Electrophoresis of RT-PCR products of MK gene and GAPDH gene, GAPDH is used as control; B: The total protein were separated by SDS gel electrophoresis, transferred to PVDF membranes, and blotted with anti-MK body. β-actin rabbit polyclonal antibodies was used as a loading control. CK: Treatment with saline; ADM: Treatment with ADM; MK-AS: Treatment with MK-AS; ADM + MK-AS: Combination of ADM with MK-AS.
- Citation: Dai LC, Wang X, Yao X, Lu YL, Ping JL, He JF. Enhanced therapeutic effects of combined chemotherapeutic drugs and midkine antisense oligonucleotides for hepatocellular carcinoma. World J Gastroenterol 2007; 13(13): 1989-1994
- URL: https://www.wjgnet.com/1007-9327/full/v13/i13/1989.htm
- DOI: https://dx.doi.org/10.3748/wjg.v13.i13.1989


