Copyright
©2007 Baishideng Publishing Group Co.
World J Gastroenterol. Mar 14, 2007; 13(10): 1528-1533
Published online Mar 14, 2007. doi: 10.3748/wjg.v13.i10.1528
Published online Mar 14, 2007. doi: 10.3748/wjg.v13.i10.1528
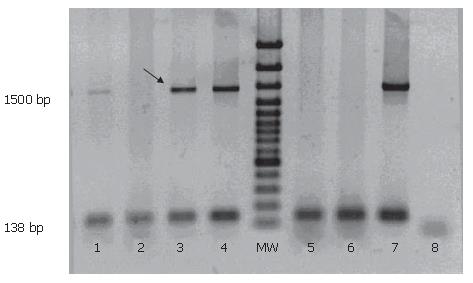
Figure 1 Long DNA analysis in patients with colon cancer in comparison with healthy individuals.
1, 2, 3, 4: Stool DNA of patients with colorectal cancer; MW: Ladder 100 bp; 5, 6: Stool DNA of healthy individuals; 7: Blood DNA as control; 8: Negative control. The arrow indicates Long DNA. Long DNA detected in 3 out of 4 patients in the picture. The 1.7% agarose gel plus ethidium bromide was used for electrophoresis at 120 volt.
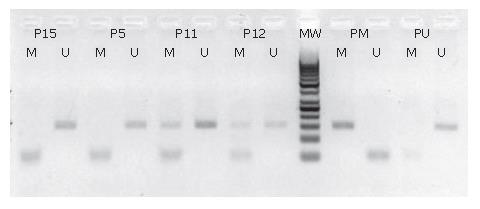
Figure 2 Methylation analysis of p16 among four patients.
P15: patient 15; P5: patient 5; P11: patient 11; P12: patient 12; MW: Ladder 50 bp; PM: Methylated control; PU: Unmethylated control; M: Methylated PCR; U: unmethylated PCR. Methylated p16 detected in patients 11 and 12.
Figure 3 Microsatellite analysis of BAT-26 in two patients with colon cancer.
BAT-26 instability detected in patient 2. P1: patient with stable BAT-26, P2: Patient with instable BAT-26, T: Tumor tissue, N: Normal margin. The gel was electrophoresed at 60 W (50 mA; 1200 V) for 60 min using 1 × TBE.
- Citation: Abbaszadegan MR, Tavasoli A, Velayati A, Sima HR, Vosooghinia H, Farzadnia M, Asadzedeh H, Gholamin M, Dadkhah E, Aarabi A. Stool-based DNA testing, a new noninvasive method for colorectal cancer screening, the first report from Iran. World J Gastroenterol 2007; 13(10): 1528-1533
- URL: https://www.wjgnet.com/1007-9327/full/v13/i10/1528.htm
- DOI: https://dx.doi.org/10.3748/wjg.v13.i10.1528


