Copyright
©2006 Baishideng Publishing Group Co.
World J Gastroenterol. Mar 7, 2006; 12(9): 1367-1372
Published online Mar 7, 2006. doi: 10.3748/wjg.v12.i9.1367
Published online Mar 7, 2006. doi: 10.3748/wjg.v12.i9.1367
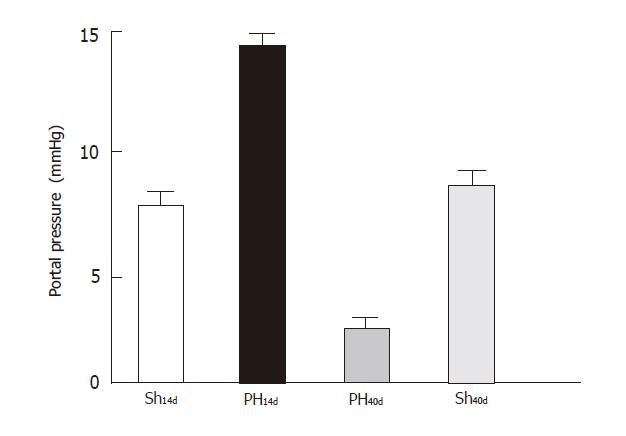
Figure 1 Portal pressure (mmHg).
Group Sh14d vs Group PH14d (P < 0.001). Group PH14d vs Group PH40d (P < 0.001). Group Sh14d vs PH40d P < 0.01. Sh14d vs Sh40d (n.s).
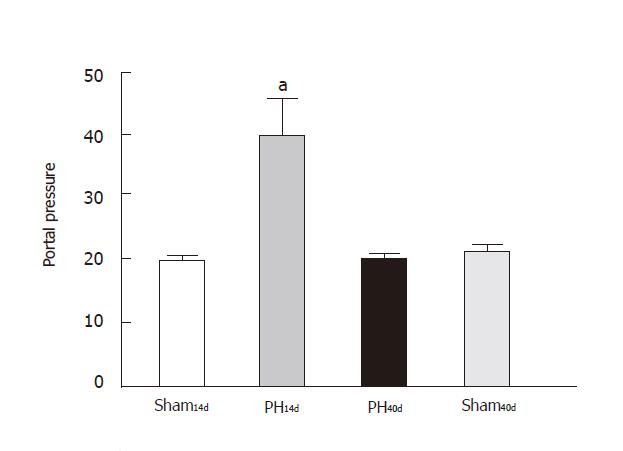
Figure 2 Protein content in cerebrospinal fluid.
Hatched column corresponds to PH14d ham shows an increased protein filtration through the BBB. This increment is not present, in black column,corresponding to PH40d Results are expressed as mean ± SE.
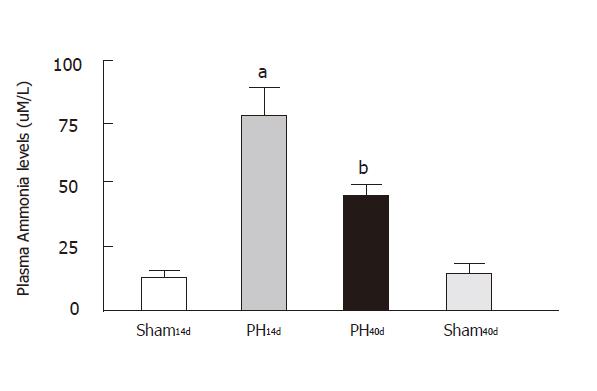
Figure 3 Plasma ammonia levels.
significant elevation of plasma ammonia content in PH14d rats correspond to hatchet column. After 40 days of portal vein ligation, the portal pressure normalized, but plasma ammonia is still high (black column).bP <0.001 and aP < 0.05, comparied to Sham column.
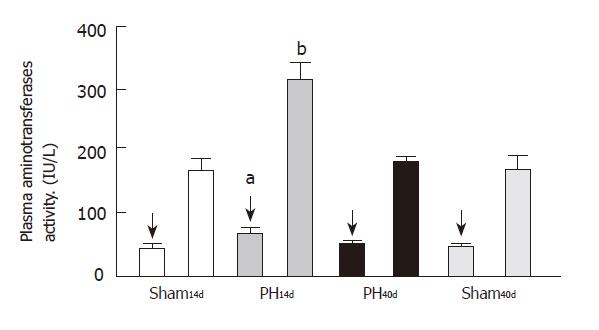
Figure 4 Plasma aminotransferases.
The first column of each group corresponds to ALT activity (arrows) and the 2nd to AST activity. Both enzymes activities appear elevated in PH14d (hatched columns) when compared to Sham14d (bP <0.001; aP <0.05).
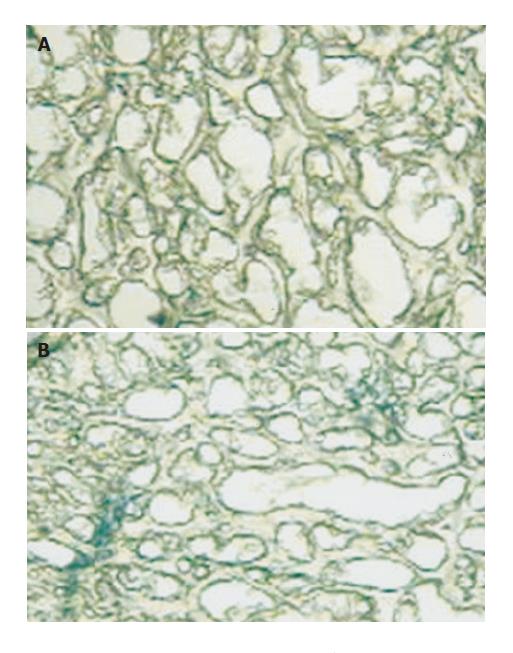
Figure 6 A: In the rest of the groups, including that were portal pressure normalized 40 days after portal vein stricture and Sham groups, the image is negative for Trypan blue dye (100 x); B: Light microscopy showed a marked Trypan blue dye diffusion in brain hippocampal of PH rats of 14 d (100 x).
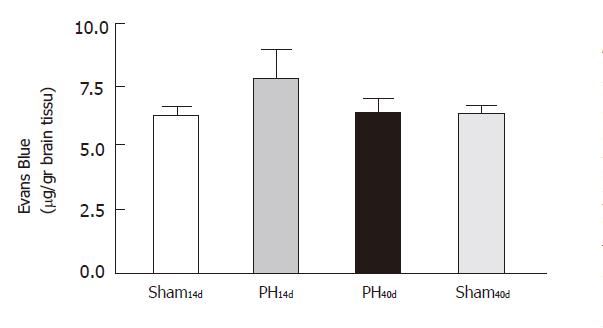
Figure 5 Evans blue test.
The systemic injection of Evans blue showed a statistically significant increase of the dye presence in the hippocampal region in PH14d presence in the indicate p < 0.01 when compared with the other 3 groups.
- Citation: Eizayaga F, Scorticati C, Prestifilippo JP, Romay S, Fernandez MA, Castro JL, Lemberg A, Perazzo JC. Altered blood-brain barrier permeability in rats with prehepatic portal hypertension turns to normal when portal pressure is lowered. World J Gastroenterol 2006; 12(9): 1367-1372
- URL: https://www.wjgnet.com/1007-9327/full/v12/i9/1367.htm
- DOI: https://dx.doi.org/10.3748/wjg.v12.i9.1367


