Copyright
©2006 Baishideng Publishing Group Co.
World J Gastroenterol. Mar 7, 2006; 12(9): 1367-1372
Published online Mar 7, 2006. doi: 10.3748/wjg.v12.i9.1367
Published online Mar 7, 2006. doi: 10.3748/wjg.v12.i9.1367
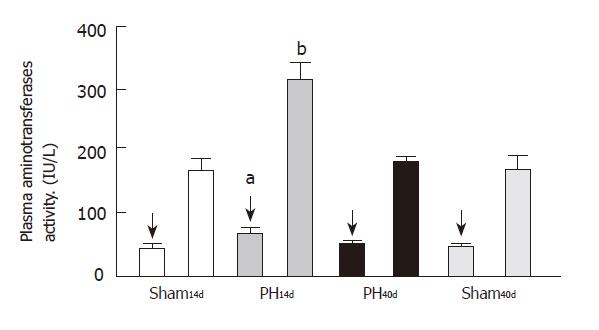
Figure 4 Plasma aminotransferases.
The first column of each group corresponds to ALT activity (arrows) and the 2nd to AST activity. Both enzymes activities appear elevated in PH14d (hatched columns) when compared to Sham14d (bP <0.001; aP <0.05).
- Citation: Eizayaga F, Scorticati C, Prestifilippo JP, Romay S, Fernandez MA, Castro JL, Lemberg A, Perazzo JC. Altered blood-brain barrier permeability in rats with prehepatic portal hypertension turns to normal when portal pressure is lowered. World J Gastroenterol 2006; 12(9): 1367-1372
- URL: https://www.wjgnet.com/1007-9327/full/v12/i9/1367.htm
- DOI: https://dx.doi.org/10.3748/wjg.v12.i9.1367


