Copyright
©2006 Baishideng Publishing Group Co.
World J Gastroenterol. Feb 21, 2006; 12(7): 1140-1143
Published online Feb 21, 2006. doi: 10.3748/wjg.v12.i7.1140
Published online Feb 21, 2006. doi: 10.3748/wjg.v12.i7.1140
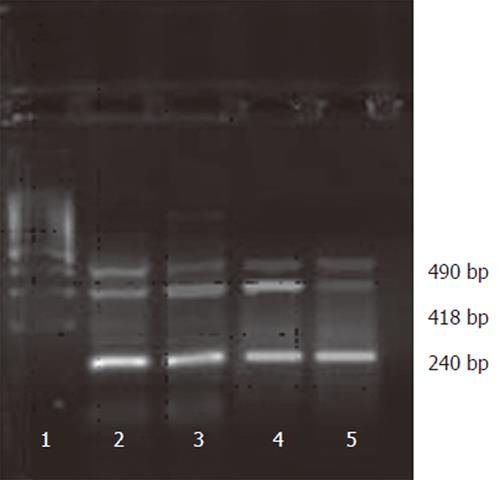
Figure 1 Expression of VEGF mRNAs.
Lanes 1- 5: 7721 group ,control group, sense group and antisense group respectively (418 bp and 490 bp indicate VEGF, 240 bp indicatesβ-actin).
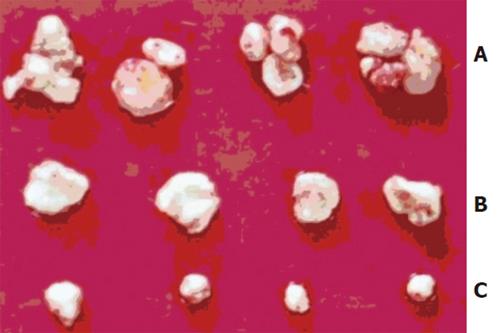
Figure 2 Gross appearance of tumor growth in sense group (A), control group (B) and antisense group (C).
The weight of tumor in antisense group was obviously lighter than that in sense and control groups (F = 21.505, P < 0.01).
-
Citation: Hao JH, Yu M, Li HK, Shi YR, Li Q, Hao XS. Inhibitory effect of antisense vascular endothelial growth factor RNA on the profile of hepatocellular carcinoma cell line
in vitro andin vivo . World J Gastroenterol 2006; 12(7): 1140-1143 - URL: https://www.wjgnet.com/1007-9327/full/v12/i7/1140.htm
- DOI: https://dx.doi.org/10.3748/wjg.v12.i7.1140


