Copyright
©2006 Baishideng Publishing Group Co.
World J Gastroenterol. Feb 7, 2006; 12(5): 723-730
Published online Feb 7, 2006. doi: 10.3748/wjg.v12.i5.723
Published online Feb 7, 2006. doi: 10.3748/wjg.v12.i5.723
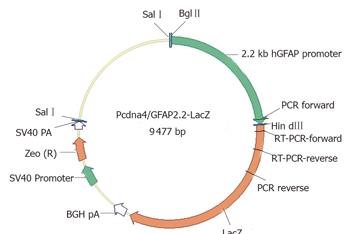
Figure 1 GFAP-lacZ transgene construct.
The bacterial lacZ reporter coding sequence was under the control of a 2.2-kb human GFAP promoter. The SV40-Zeocin gene provides a resistance to antibiotic selection for stable clones. Primer locations for PCR and RT-PCR were also indicated.
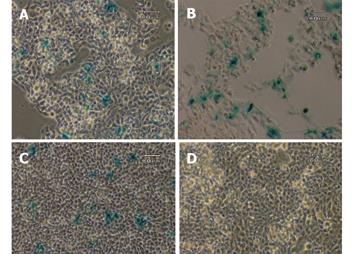
Figure 2 Transient transfection with CMV-lacZ and GFAP-lacZ transgenes.
Hepatocyte cell lines C3A (A), HepG2 (B), and fibroblast cell line NIH/3T3 (C) transfected with the ubiquitous CMV-lacZ transgene displayed blue color after 2 h of X-gal staining. In contrast, C3A (D), HepG2 (E) and NIH/3T3 (F) transfected with the GFAP-lacZ transgene did not show any blue color. Scale bar = 60 µm.
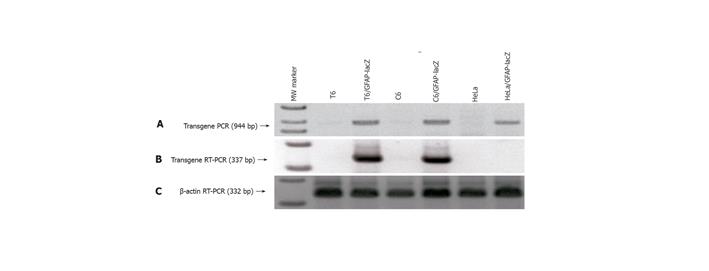
Figure 3 Verification of GFAP-lacZ transgene integration into host genome and legitimate expression in appropriate cell types.
A: PCR of genomic DNA isolated from the transfected T6 (lane 3), C6 (lane 5) and HeLa (lane 7) showed the presence of a transgene band at 944 bp, and the absence of such band from the nontransfected T6 (lane 2), C6 (lane 4), and HeLa (lane 6); B: RT-PCR of total RNAs demonstrated that transgene only expressed in the transfected T6 (lane 3) and C6 (lane 5), but not in the transfected HeLa (lane 7); C: RT-PCR of β-actin as a reference ensuring equal sample loading. Lane 1 is the 1-kb ladder marker.
Figure 4 X-gal staining of stable transfectants.
The GFAP-lacZ transgene expressed in the rat hepatic stellate cell line T6 (A), and the positive control rat astrocytic cell line C6 (B), but not in the non-GFAP-expressing cell line HeLa (C). Scale bar = 60 µm.
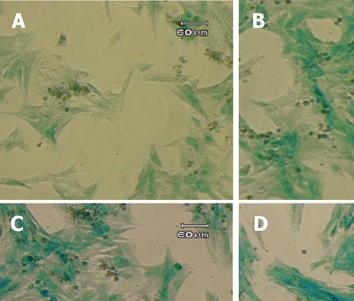
Figure 5 Induction of GFAP-lacZ transgene expression by TGF-β1.
The T6/lacZ/C1 cells were cultured and incubated in full DMEM supplemented with 0 (A), 0.1 (B), 1 (C), and 10 (D) ng/mL of TGF-β1 for 3 days, and stained with X-gal substrate for 1 h. Cells treated TGF-β1 displayed more intense blue staining and more activated morphology (thicken processes). Scale bar = 60 µm.
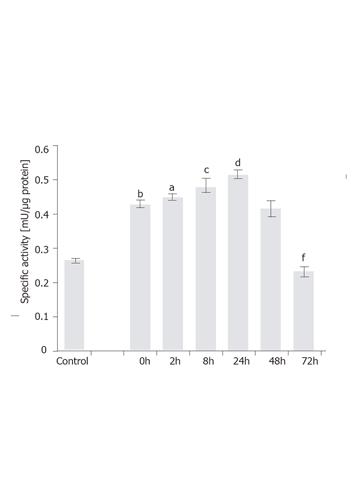
Figure 6 Time-dependent induction of GFAP-lacZ gene by TGF-β1 in the T6/lacZ/C1 cells.
Cells were grown in full DMEM was assayed for basal β-galactosidase activity (control). Cells adopted in low serum DMEM for 12 h were supplemented with 1 ng/mL of TGF-β1 for various times (0, 2, 8, 24, 48, and 72 h), and assayed for enzymatic activity. When compared to the basal level, cells cultured in low serum DMEM had elevated level of transgene expression (bP < 0.001). When compared the 0 h, transgene expression level was significantly induced at 2 h (aP < 0.05), 8 h (cP < 0.005), and 24 h (dP < 0.001), but significantly reduced at 72 h (fP < 0.001) compared with 0 h. Data presented as mean ± SE.
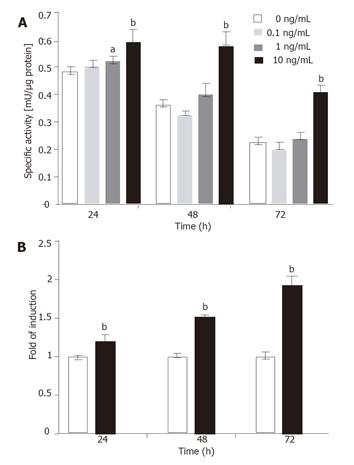
Figure 7 Dose-dependent induction of transgene.
(A) The T6/lacZ/C1 cells cultured in low serum DMEM supplemented with different concentrations of TGF-β1 (0, 0.1, 1, and 10 ng/mL) for various times (24, 48, and 72 h) were assayed for β-galactosidase activity. The transgene was significantly induced by 10 ng/mL of TGF-β1 at all time points. (B) Data extracted from (A) illustrated that the fold of induction increased with times, despite the drop in absolute enzymatic activity. Data presented as mean ± SE. aP < 0.05, bP < 0.001 compared with no cytokine treatment.
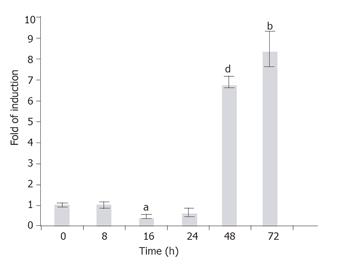
Figure 8 Time-dependent induction of the endogenous GFAP gene by TGF-b1.
T6/GFAP-LacZ cells were incubated with 1 ng/mL of TGF-b1 in low serum DMEM for various times (0, 8, 16, 24, 48, and 72 h), and the endogenous rat GFAP mRNA was quantified with real-time RT-PCR. Data were presented as mean ± SE. bP < 0.01, aP < 0.005 and dP < 0.001, when compared to treatment at 0 h.
-
Citation: Maubach G, Lim MCC, Zhang CY, Zhuo L. GFAP promoter directs
lacZ expression specifically in a rat hepatic stellate cell line. World J Gastroenterol 2006; 12(5): 723-730 - URL: https://www.wjgnet.com/1007-9327/full/v12/i5/723.htm
- DOI: https://dx.doi.org/10.3748/wjg.v12.i5.723


