Copyright
©2006 Baishideng Publishing Group Co.
World J Gastroenterol. Dec 21, 2006; 12(47): 7604-7612
Published online Dec 21, 2006. doi: 10.3748/wjg.v12.i47.7604
Published online Dec 21, 2006. doi: 10.3748/wjg.v12.i47.7604
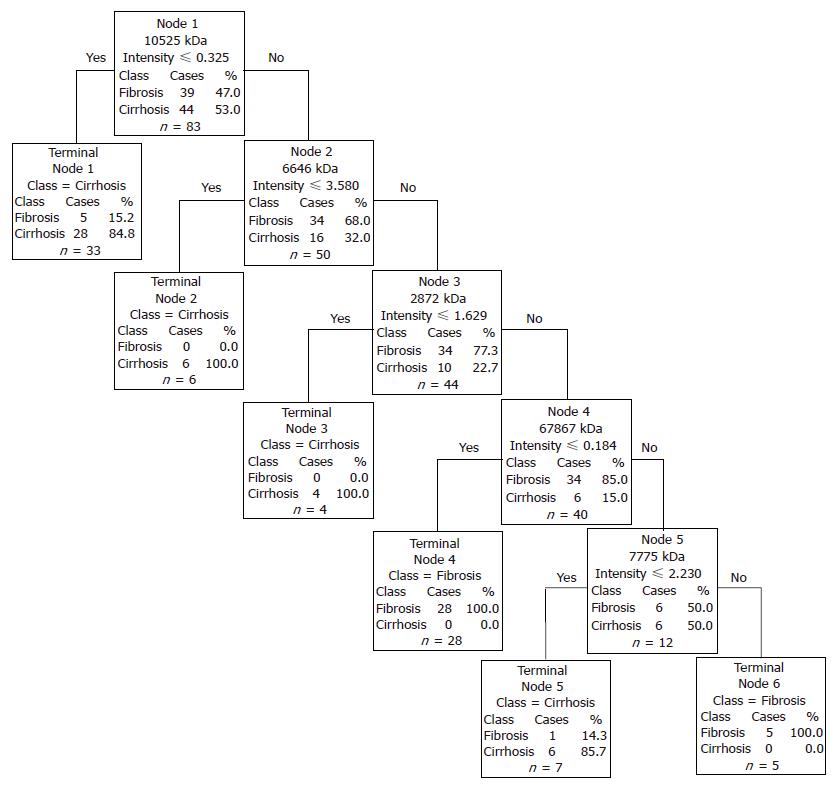
Figure 1 Decision tree for the differentiation of fibrosis versus cirrhosis.
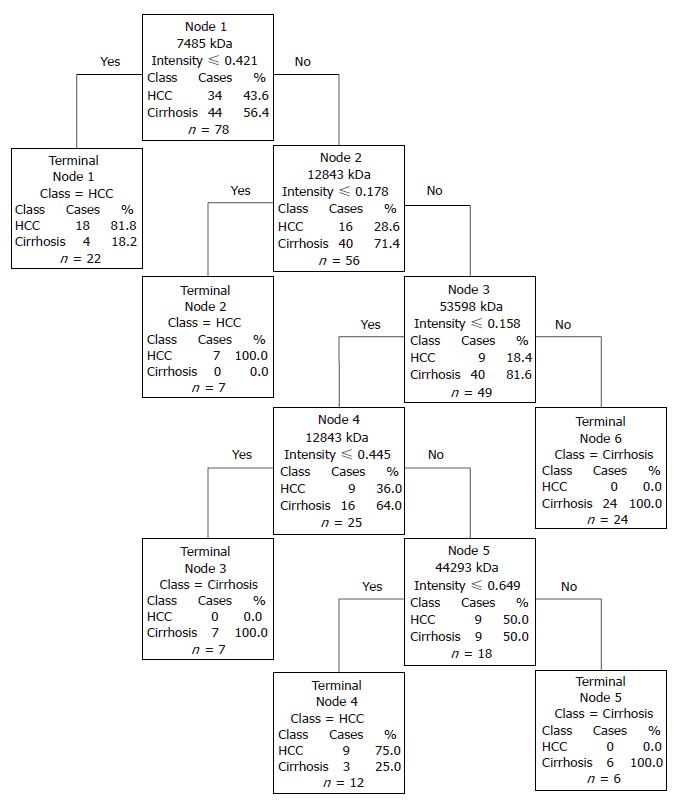
The root nodes contain the mass of the selected peak (“node”) which is followed by the intensity value. Samples with intensities lower or equal to the intensity value go to the left terminal node, samples with higher intensities go to the next right descendant nodes.
Figure 2 Decision tree for the differentiation of HCC versus cirrhosis.
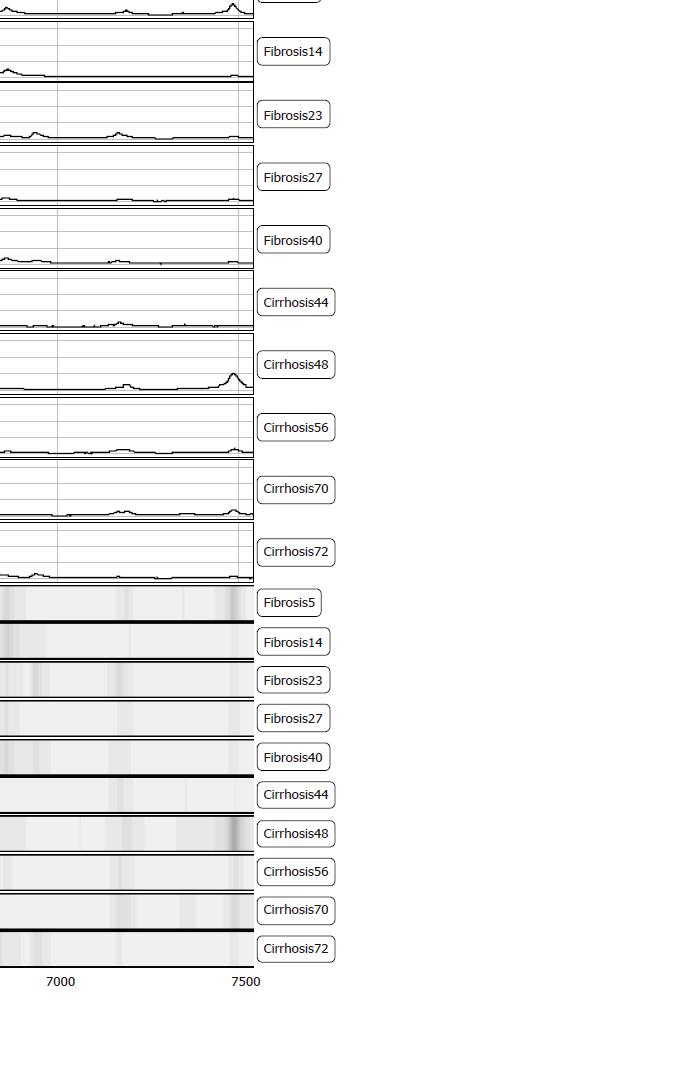
Figure 3 Representative protein spectra of the 6.
6 kDa peak and gel view (below) for the differentiation of fibrosis versus cirrhosis patients. Numbering of patients is according to internally used data.
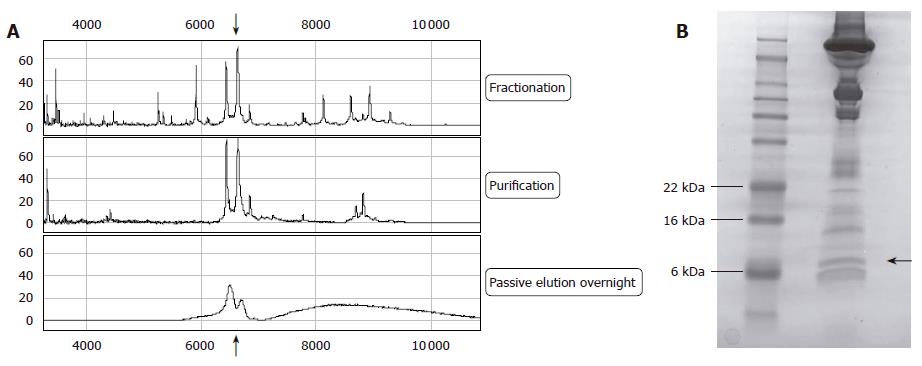
Figure 4 Isolation of the 6.
6 kDa peak. First line shows spectrum after fractionation of the sample with Q Ceramic HyperD®F spin columns, the second line shows the spectra after purification using reverse phase chromatography. The last line spectra represent the purified biomarker on a NP20 array after SDS-gel purification and passive elution. The arrow indicates the 6.6 kDa peak (A); One-dimensional SDS polyacrylamide gel electrophoresis after staining of enriched sample (second lane). First lane: molecular marker proteins (See Blue® Plus2, Invitrogen, Carlsbad, USA). The arrow indicates the 6.6 kDa protein (B).
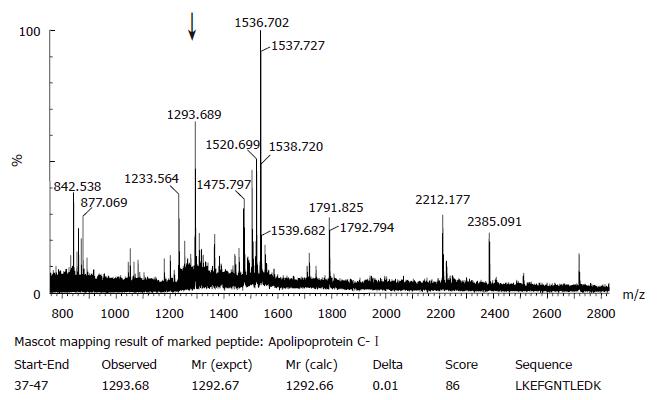
Figure 5 Peptide mass fingerprint spectra of the 6.
6 kDa biomarker after trypsin digestion using a Micomass Q quattro 2Q-TOF tandem quadruple TOF mass spectrometer equipped with a SELDI-TOF MS ProteinChip Interface PCI1000. The arrow indicates the peptide with the highest score in the database search. Mascot search results of the same peptide are shown below including start and end position of the found peptide sequence, the observed, experimental and calculated mass from the matched peptide sequence, the mass difference (delta), achieved ion score and the peptide sequence.
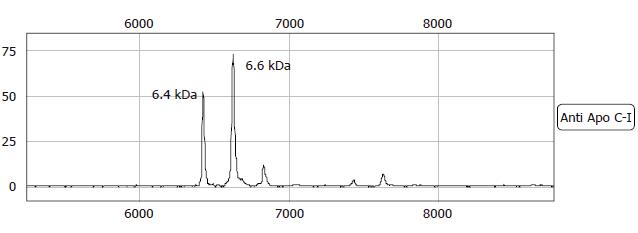
Figure 6 MS-spectrum of the immunoassay capture using a rabbit anti-human apolipoprotein C-I antibody on a NP20 array.
Same peaks as seen in the passive elution are shown. The 6.6 kDa represents Apo C-I, the 6.4 kDa peak is Apolipoprotein C-I missing two N-terminal amino acids.
- Citation: Göbel T, Vorderwülbecke S, Hauck K, Fey H, Häussinger D, Erhardt A. New multi protein patterns differentiate liver fibrosis stages and hepatocellular carcinoma in chronic hepatitis C serum samples. World J Gastroenterol 2006; 12(47): 7604-7612
- URL: https://www.wjgnet.com/1007-9327/full/v12/i47/7604.htm
- DOI: https://dx.doi.org/10.3748/wjg.v12.i47.7604


