Copyright
©2006 Baishideng Publishing Group Co.
World J Gastroenterol. Dec 7, 2006; 12(45): 7299-7303
Published online Dec 7, 2006. doi: 10.3748/wjg.v12.i45.7299
Published online Dec 7, 2006. doi: 10.3748/wjg.v12.i45.7299
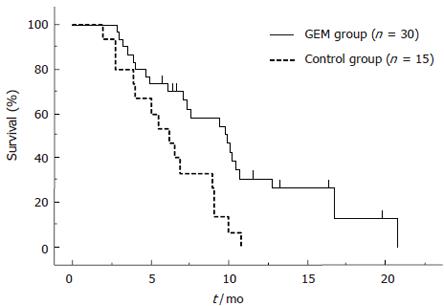
Figure 1 Survival time in GEM and control groups (9.
87 ± 0.33 vs 6.23 ± 0.93, P = 0.004).
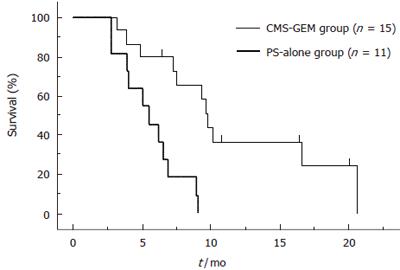
Figure 2 Survival curves of CMS-GEM and PS-alone groups (9.
87 ± 0.43 vs 5.53 ± 0.94, P = 0.001).
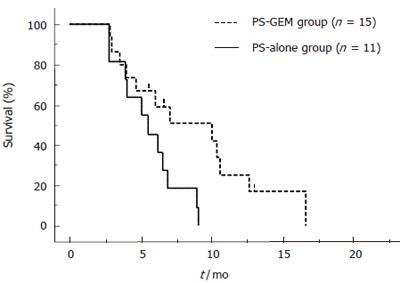
Figure 3 Survival curves of PS-GEM and PS-alone groups (10.
1 ± 2.70 vs 5.53 ± 0.94, P = 0.02).
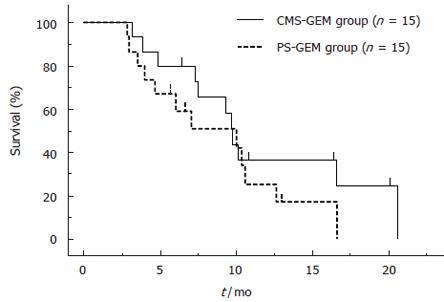
Figure 4 Survival curves of CMS-GEM and PS-GEM groups (9.
87 ± 0.43 vs 10.1 ± 2.70, P = 0.26).
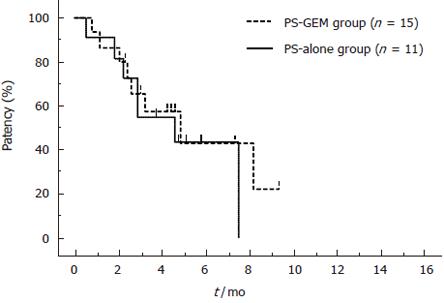
Figure 5 Stent patency in PS-GEM and PS-alone groups (5.
00 ± 2.26 vs 4.53 ± 1.31, P = 0.59).
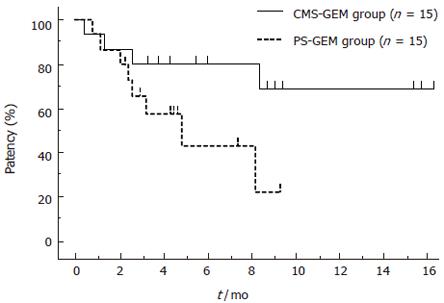
Figure 6 Stent patency in CMS-GEM and PS-GEM groups (7.
49 ± 0.82 vs 5.0 ± 2.26, P = 0.03).
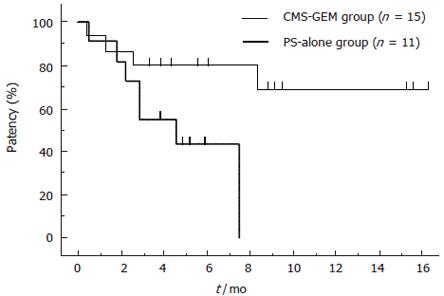
Figure 7 Stent patency in CMS-GEM and PS-alone groups (7.
49 ± 0.82 vs 4.53 ± 1.31, P = 0.01).
- Citation: Takasawa O, Fujita N, Kobayashi G, Noda Y, Ito K, Horaguchi J. Endoscopic biliary drainage for patients with unresectable pancreatic cancer with obstructive jaundice who are to undergo gemcitabine chemotherapy. World J Gastroenterol 2006; 12(45): 7299-7303
- URL: https://www.wjgnet.com/1007-9327/full/v12/i45/7299.htm
- DOI: https://dx.doi.org/10.3748/wjg.v12.i45.7299


