Copyright
©2006 Baishideng Publishing Group Co.
World J Gastroenterol. Nov 28, 2006; 12(44): 7113-7117
Published online Nov 28, 2006. doi: 10.3748/wjg.v12.i44.7113
Published online Nov 28, 2006. doi: 10.3748/wjg.v12.i44.7113
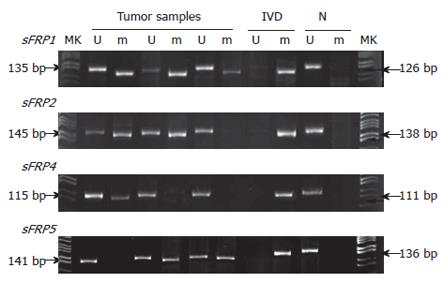
Figure 1 Hypermethylation of sFRP genes in colorectal tissues.
Tumor samples showed unmethylated (U) and methylted (m) bands, but normal tissues (N) showed only unmethylated bands. The in vitro methylated DNA (IVD) serves as a positive control of methylated sFRP genes.
Figure 2 Hypermethylation of sFRP genes in colorectal tumor samples (T) and the corresponding normal tissues adjacent to them (AN).
The tumors showed stronger methylation signals than the adjacent normal tissues.
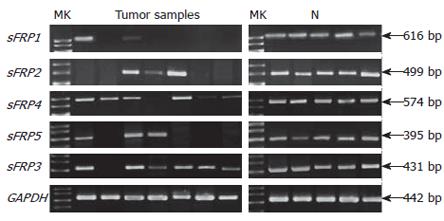
Figure 3 Expression of sFRP gene family in colorectal tumor and normal tissues (N).
The gene GAPDH serves as a positive indicator for RNA quality and loading.
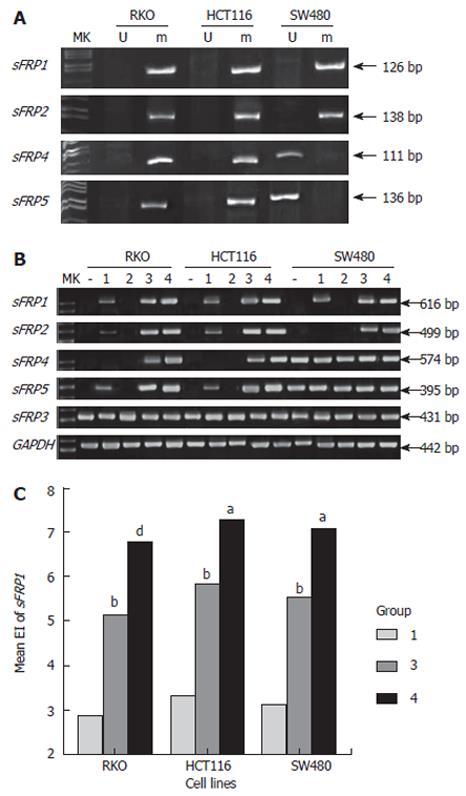
Figure 4 A: Hypermethylation of sFRP genes in colorectal cancer cell lines; B: The mRNA expression level of sFRP genes in colorectal cancer cell lines before and after demethylation treatment.
Three cell lines all received 4 different treatments: never treated (-), low-dose DAC (1), TSA (2), high-dose DAC (3), DAC + TSA (4); C: The sFRP1 gene expression index (EI) in three cell lines after demethylation treatment, low-dose DAC (1), high-dose DAC (3), DAC+TSA (4). bP < 0.01 vs 1, dP < 0.01 vs 3, aP < 0.05 vs 3.
- Citation: Qi J, Zhu YQ, Luo J, Tao WH. Hypermethylation and expression regulation of secreted frizzled-related protein genes in colorectal tumor. World J Gastroenterol 2006; 12(44): 7113-7117
- URL: https://www.wjgnet.com/1007-9327/full/v12/i44/7113.htm
- DOI: https://dx.doi.org/10.3748/wjg.v12.i44.7113


