Copyright
©2006 Baishideng Publishing Group Co.
World J Gastroenterol. Jan 28, 2006; 12(4): 582-587
Published online Jan 28, 2006. doi: 10.3748/wjg.v12.i4.582
Published online Jan 28, 2006. doi: 10.3748/wjg.v12.i4.582
Figure 1 Schematic representation of manometry recording periods in two patients: ventilated and fasting (gray), non-ventilated and fasting (white), non-ventilated and feeding (black); and analysis periods: early ventilation (EV) (1-5 h), early post-operative (EP) (20-24 h), early feeding (EF) (29-33 h), late feeding (LF) (53-57 h) and late post-operative (LP) (68-72 h).
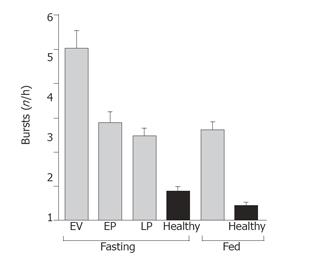
Figure 2 Bursts recorded during fasting (early ventilation (EV) (1-5 h), early post-operative (EP) (20-24 h) and late post-operative (LP) (68-72 h)) and enteral feeding, in patients (gray shading) and healthy controls (black shading) (n = 7).
Data are mean±SE. P < 0.0001 vs healthy fasting, P < 0.0001 vs healthy fed. early ventilation (n = 9), early post-operative (n = 7), enteral feeding (n = 8), late post-operative (n = 9).
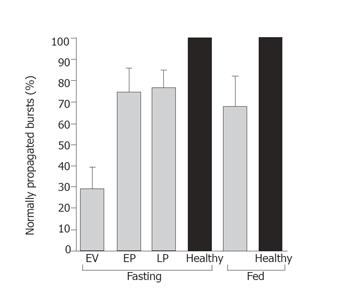
Figure 3 Normal burst activity (% of total burst activity) recorded during fasting (early ventilation (EV) (1-5 h), early post-operative (EP) (20-24 h) and late post-operative (LP) (68-72 h)) and enteral feeding in patients (gray shading) and healthy control subjects (black shading) (n = 7).
Data are mean±SE. P < 0.01 vs late post-operative. early ventilation (n = 9), early post-operative (n = 7), enteral feeding (n = 8), late post-operative (n = 9).
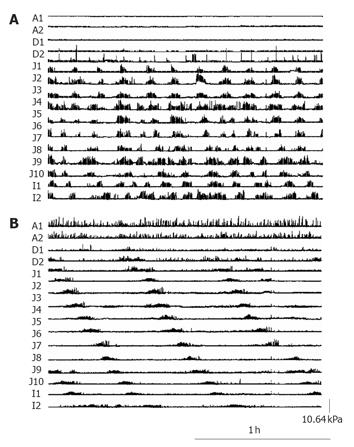
Figure 4 Sample patient small intestinal manometric tracing during fasting.
A: d 1 showing characteristic disordered burst activity with simultaneous onset and retrograde propagation; B: d 3 bursting activity is less frequent and predominantly antegrade.
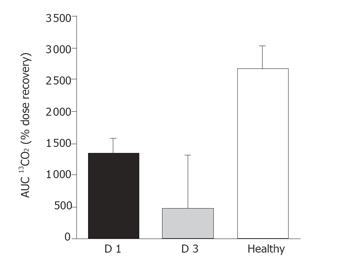
Figure 5 Area under the curve for percentage dose recovery of 13CO2 until 6 h after the start of the intraduodenal infusion on d 1 (n = 7) and d 3 (n = 4) post surgery in AAA repair patients and in healthy subjects (n = 8).
P < 0.05 vs healthy. Data are mean±SE.
- Citation: Fraser RJ, Ritz M, Matteo ACD, Vozzo R, Kwiatek M, Foreman R, Stanley B, Walsh J, Burnett J, Jury P, Dent J. Distal small bowel motility and lipid absorption in patients following abdominal aortic aneurysm repair surgery. World J Gastroenterol 2006; 12(4): 582-587
- URL: https://www.wjgnet.com/1007-9327/full/v12/i4/582.htm
- DOI: https://dx.doi.org/10.3748/wjg.v12.i4.582


