Copyright
©2006 Baishideng Publishing Group Co.
World J Gastroenterol. Sep 7, 2006; 12(33): 5320-5325
Published online Sep 7, 2006. doi: 10.3748/wjg.v12.i33.5320
Published online Sep 7, 2006. doi: 10.3748/wjg.v12.i33.5320
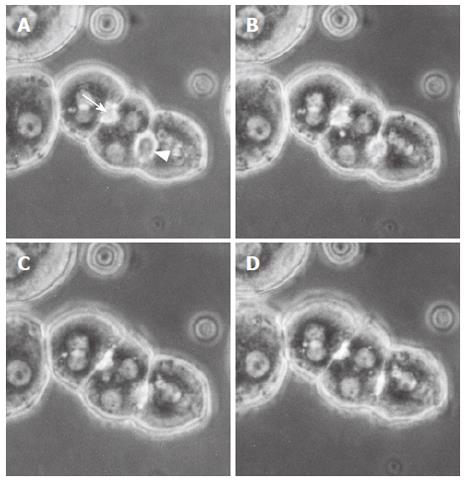
Figure 1 Representative phase contrast micrographs of an isolated hepatocyte triplet in the controls.
Figures A, B, C and D show a sequence of the bile canalicular contractions. A bile canaliculus indicated by an arrowhead started to contract (A) and completed contraction (D). Another canaliculus indicated by an arrow started its contraction (B) and completed contraction (C). These canalicular contractions were forceful and repetitive.
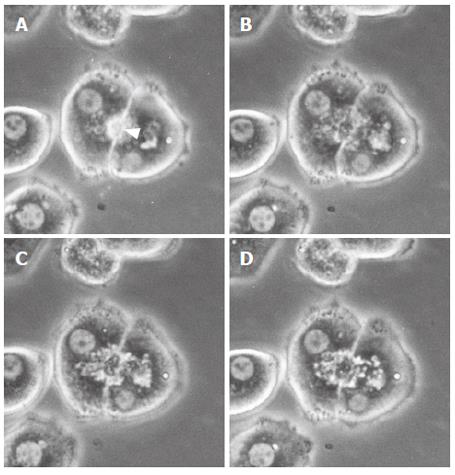
Figure 2 Representative phase contrast micrographs of an isolated hepatocyte couplet in the taurolithocholate (TLC)-treated groups (50 μmol/L).
Prior to addition (A) and after the addition of TLC (B, C, D). A canaliculus (arrowhead) between two hepatocytes (A) was deformed, and canalicular bile was incorporated into the vacuoles in the hepatocyte cytoplasm immediately after the addition of TLC (B). Thereafter, the bile canaliculi were gradually dilated, and the canalicular contractions were markedly impaired (C, D). In the TLC-treated groups, the movements of small particles became extremely slow, and cytoplasmic vesicles and vacuoles were noted in the pericanalicular region.
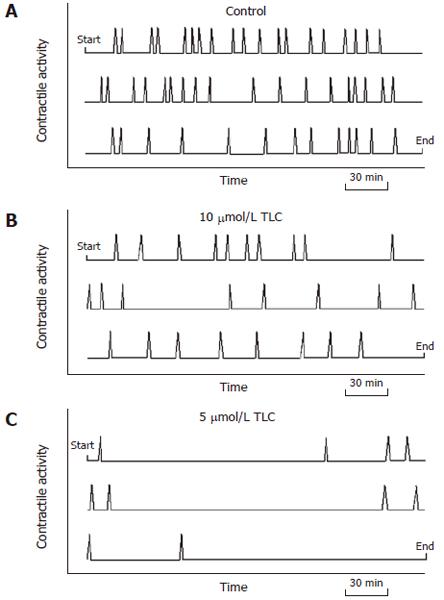
Figure 3 Graphic display of the representative contraction activity of bile canaliculi.
Diagrams represent the 12 h period of observation, beginning at the upper left corner and ending at the lower right corner. The canalicular contractions (spikes) occurred at regular intervals in the control groups (A). The contraction activity visibly diminished as the TLC dosage increased (B, C).
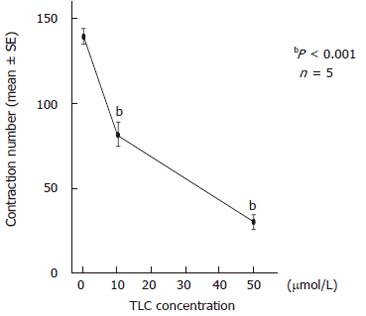
Figure 4 Effects of taurolithocholate (TLC) on the contraction number of bile canaliculi.
The total contraction number of 3 bile canaliculi for 12 h was 139.4 ± 4.5 (mean ± SE) in the controls, and it significantly decreased to 82.4 ± 6.1 at 10 μmol/L TLC and 30.2 ± 3.1 at 50 μmol/L. The contraction number markedly decreased as the TLC dosage increased.
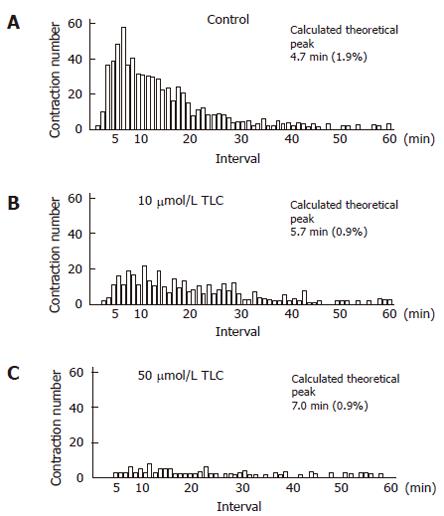
Figure 5 Effects of taurolithocholate (TLC) on the contraction interval of bile canaliculi.
The histogram of the canalicular contraction interval revealed Poisson distribution. In the TLC-treated groups, there was a tendency for the peak height to decrease and shift to the right. The calculated theoretical peak values for each dose were 4.7 min in the control groups (A), 5.7 min at 10 μmol/L TLC (B) and 7.0 min at 50 μmol/L (C). Normalized errors are indicated in parentheses.
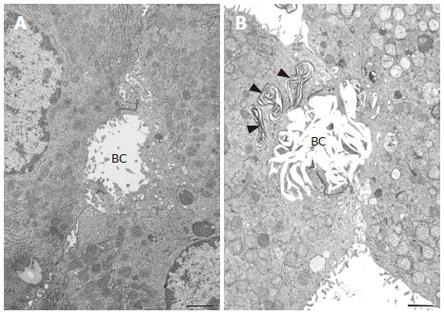
Figure 6 Transmission electron micrographs of isolated hepatocytes.
A bar indicates 1 μm. A: Normal hepatocytes prior to the addition of taurolithocholate (TLC). A bile canaliculus (BC) was slightly dilated and filled with microvilli. B: 12 h after the addition of 50 μmol/L TLC. Note the characteristic lamellar transformation of the bile canalicular membranes. A bile canaliculus (BC) was deformed and dilated with a loss of microvilli. Electron dense membranous structures of biliary materials (arrowheads) were found in the vacuoles in the pericanalicular region.
- Citation: Watanabe N, Kagawa T, Kojima SI, Takashimizu S, Nagata N, Nishizaki Y, Mine T. Taurolithocholate impairs bile canalicular motility and canalicular bile secretion in isolated rat hepatocyte couplets. World J Gastroenterol 2006; 12(33): 5320-5325
- URL: https://www.wjgnet.com/1007-9327/full/v12/i33/5320.htm
- DOI: https://dx.doi.org/10.3748/wjg.v12.i33.5320


