Copyright
©2006 Baishideng Publishing Group Co.
World J Gastroenterol. Aug 21, 2006; 12(31): 4981-4985
Published online Aug 21, 2006. doi: 10.3748/wjg.v12.i31.4981
Published online Aug 21, 2006. doi: 10.3748/wjg.v12.i31.4981
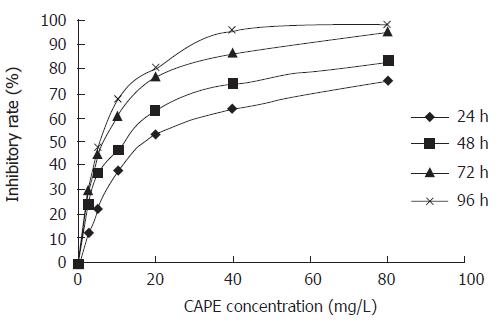
Figure 1 Effect of CAPE on SW480 cell proliferation.
SW480 cells were treated with CAPE at indicated concentrations for 24, 48, 72 and 96 h. The cell viability was determined by MTT assay.
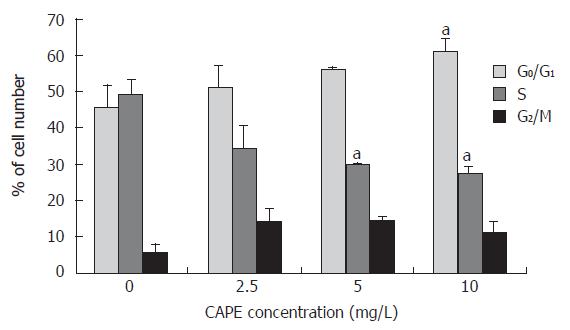
Figure 2 Effect of CAPE on SW480 cell cycle distribution.
The percentage of cells in each phase of the cell cycle, G0/G1, S, and G2/M was determined by FCM after cells were treated with indicated concentrations (2.5, 5 and 10 mg/L) of CAPE for 24 h. aP < 0.05 vs the control group, treated with vehicle, DMSO only.
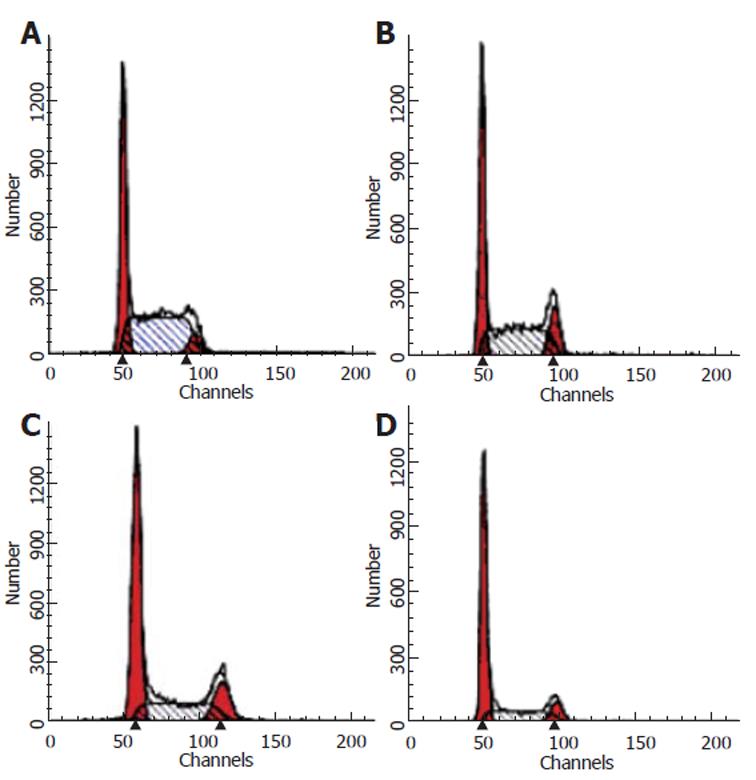
Figure 3 Flow cytometry analysis of SW480 cells following 24 h incubation with CAPE (A) 0 mg/L, (B) 2.
5 mg/L, (C) 5 .0 mg/L, (D) 10 mg/L.
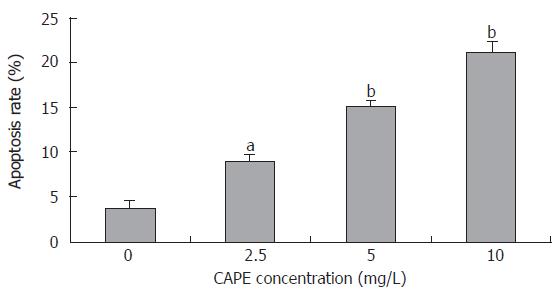
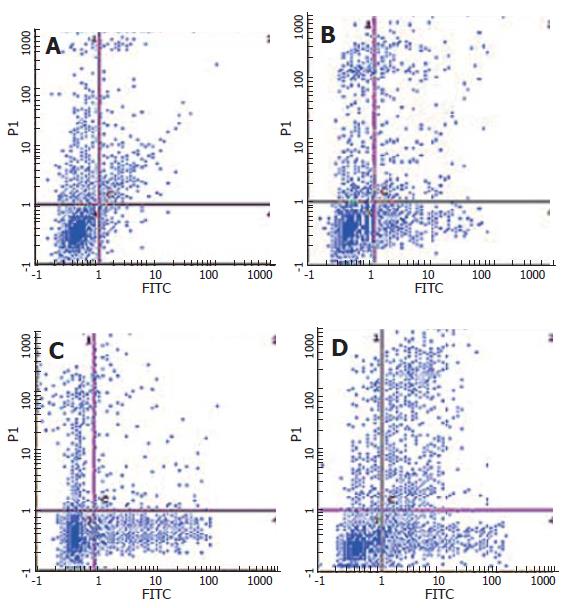
Figure 4 Effect of CAPE on SW480 cell apoptosis.
After treated with CAPE at indicated concentrations for 24 h, the SW480 cell apoptosis rates were analyzed by Annexin-V and PI double-staining flow cytometry. aP < 0.05, bP < 0.01 vs the control group.
Figure 5 Annexin-V and PI double-staining flow cytometry analysis of SW480 cells following 24 h incubation with CAPE (A) 0 mg/L, (B) 2.
5 mg/L, (C) 5.0 mg/L, (D) 10 mg/L.
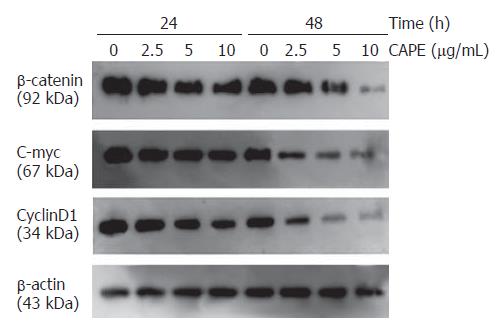
Figure 6 Western blot analysis of β-catenin, c-myc and cyclinD1 protein expression in SW480 cells following 24 and 48 h incubation with indicated concentrations of CAPE.
β-actin served as a loading control.
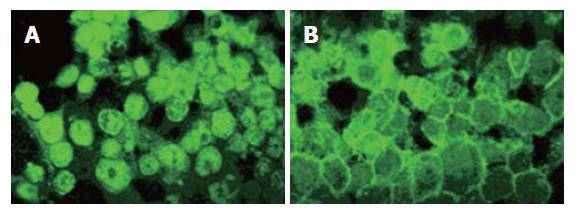
Figure 7 Indirect immunofluorescence analysis of β-catenin protein localization in SW480 cells following 48 h incubation with CAPE (A) 0 mg/L, (B) 10 mg/L.
- Citation: He YJ, Liu BH, Xiang DB, Qiao ZY, Fu T, He YH. Inhibitory effect of caffeic acid phenethyl ester on the growth of SW480 colorectal tumor cells involves β-catenin associated signaling pathway down-regulation. World J Gastroenterol 2006; 12(31): 4981-4985
- URL: https://www.wjgnet.com/1007-9327/full/v12/i31/4981.htm
- DOI: https://dx.doi.org/10.3748/wjg.v12.i31.4981


