Copyright
©2006 Baishideng Publishing Group Co.
World J Gastroenterol. Aug 14, 2006; 12(30): 4843-4849
Published online Aug 14, 2006. doi: 10.3748/wjg.v12.i30.4843
Published online Aug 14, 2006. doi: 10.3748/wjg.v12.i30.4843
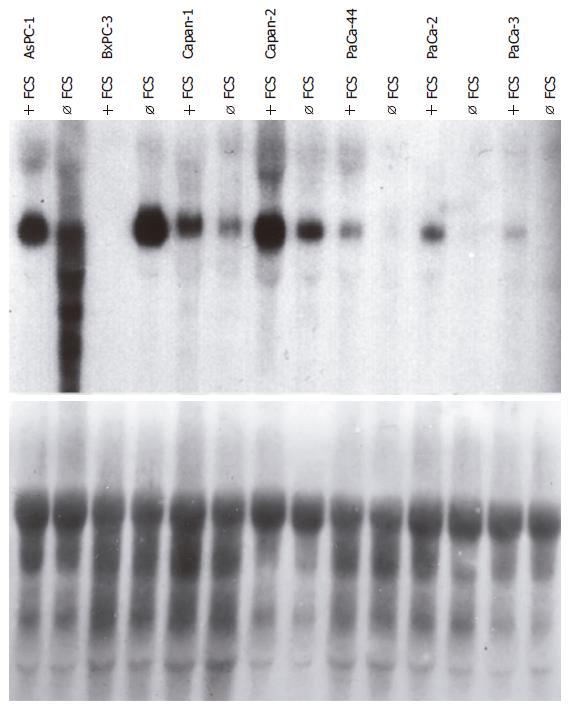
Figure 1 Northern blot of human pancreatic carcinoma cell lines utilizing a cDNA probe for tissue factor (TF) and a ribosomal cDNA control probe (S138).
Cell culture conditions with and without (ø) fetal calf serum (FCS).
Figure 2 Assessment of TF and asTF expression by RT-PCR.
1: DLD-1; 2: SW48; 3: PANC-1; 4: BxPC-3; 5: PaCa-44; 6: Capan-2; 7: Capan-1; 8: AsPC-1; 9: NP9; 10: NP29; 11: HeLa; 12: Fibroblasts; 13: Negative control.
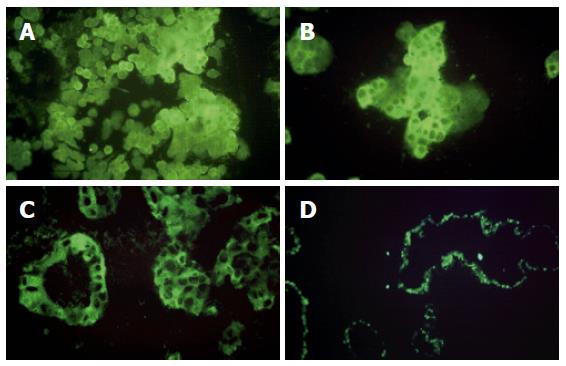
Figure 3 Representative demonstration of tissue factor (TF) expression by immunofluorescence in AsPC-1 (A) and CAPAN-1 (B) pancreatic cancer cell lines, in tissue of pancreatic cancer (C) and chronic pancreatitis (D).
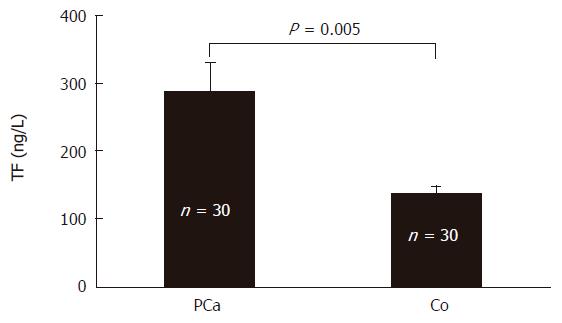
Figure 4 Plasma concentrations of tissue factor (TF) in patients with pancreatic cancer (PCa) versus controls (Co).
Bars indicate means and standard deviation.
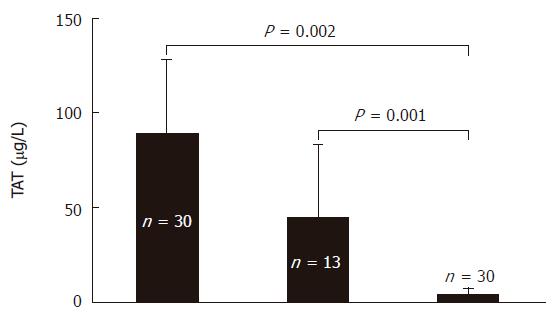
Figure 5 Plasma concentrations of thrombin-antithrombin complex (TAT) in patients with pancreatic cancer (PCa), chronic pancreatitis (CP) and healthy controls (Co).
Bars indicate means and standard deviation.
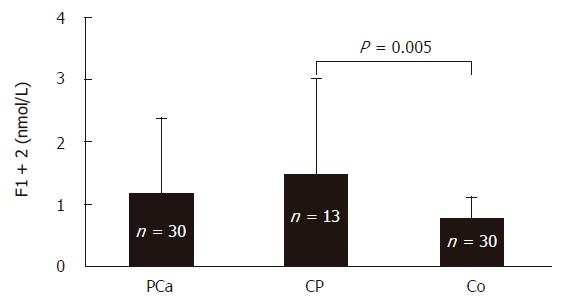
Figure 6 Plasma concentrations of prothrombin fragment 1 + 2 (F1 + 2) in patients with pancreatic cancer (PCa), chronic pancreatitis (CP) and healthy controls (Co).
Bars indicate means and standard deviation.
- Citation: Haas SL, Jesnowski R, Steiner M, Hummel F, Ringel J, Burstein C, Nizze H, Liebe S, Löhr JM. Expression of tissue factor in pancreatic adenocarcinoma is associated with activation of coagulation. World J Gastroenterol 2006; 12(30): 4843-4849
- URL: https://www.wjgnet.com/1007-9327/full/v12/i30/4843.htm
- DOI: https://dx.doi.org/10.3748/wjg.v12.i30.4843


