Copyright
©2006 Baishideng Publishing Group Co.
World J Gastroenterol. Jul 21, 2006; 12(27): 4325-4330
Published online Jul 21, 2006. doi: 10.3748/wjg.v12.i27.4325
Published online Jul 21, 2006. doi: 10.3748/wjg.v12.i27.4325
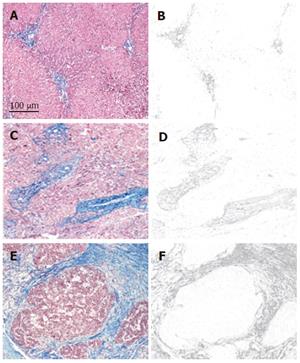
Figure 1 Hematoxylin-eosin staining of the surgical specimens (A, C, and E).
The images scanned and depicted only blue signals using a computer program. The blue signals were calculated as the area of fibrosis (B, D, and F). The results of such fibrosis were 3.2% for B, 12.2% for D, and 27.7% for F. The bar shows 100 μm.
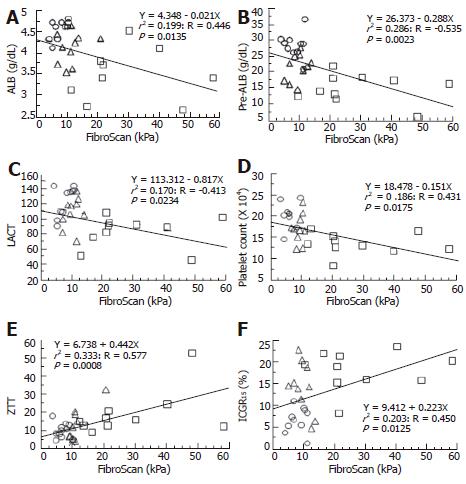
Figure 2 A linear regression analysis of FibroScan and clinical laboratory tests including liver functional markers.
A negative correlation was seen for ALB (A), pre-ALB (B), lecithine-cholesterol acyltransferase (LCAT) (C), and platelet count (D). On the other hand, a positive correlation was seen for ZTT (E) and ICGR15 (F). ○: NBNC and normal liver; △: HBV and chronic hepatitis; □: HCV and liver cirrhosis.
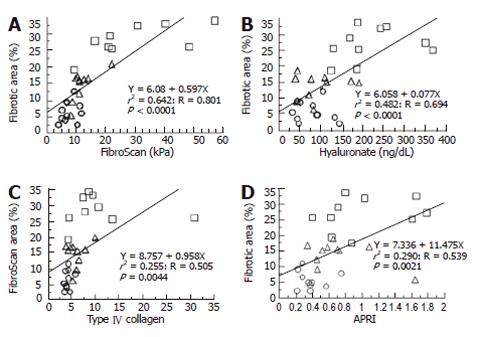
Figure 3 A linear regression analysis of the fibrotic area and liver fibrotic markers including FibroScan.
A positive correlation was seen for all the markers such as FibroScan (A), hyaluronate (B), type IV collagen (C), and aspartate transaminase levels in comparison to the platelet ratio index (APRI) (D). ○: NBNC and normal liver; △: HBV and chronic hepatitis; □: HCV and liver cirrhosis.
- Citation: Kawamoto M, Mizuguchi T, Katsuramaki T, Nagayama M, Oshima H, Kawasaki H, Nobuoka T, Kimura Y, Hirata K. Assessment of liver fibrosis by a noninvasive method of transient elastography and biochemical markers. World J Gastroenterol 2006; 12(27): 4325-4330
- URL: https://www.wjgnet.com/1007-9327/full/v12/i27/4325.htm
- DOI: https://dx.doi.org/10.3748/wjg.v12.i27.4325


