Copyright
©2006 Baishideng Publishing Group Co.
World J Gastroenterol. Jul 21, 2006; 12(27): 4325-4330
Published online Jul 21, 2006. doi: 10.3748/wjg.v12.i27.4325
Published online Jul 21, 2006. doi: 10.3748/wjg.v12.i27.4325
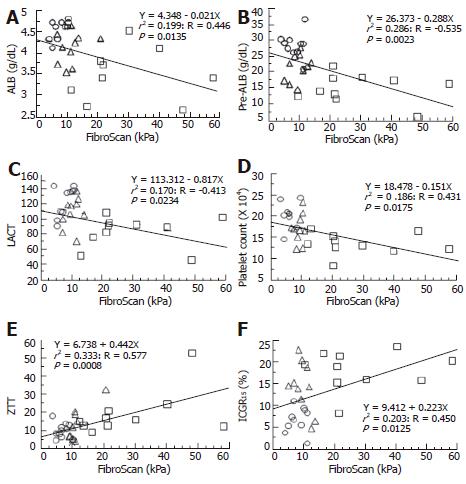
Figure 2 A linear regression analysis of FibroScan and clinical laboratory tests including liver functional markers.
A negative correlation was seen for ALB (A), pre-ALB (B), lecithine-cholesterol acyltransferase (LCAT) (C), and platelet count (D). On the other hand, a positive correlation was seen for ZTT (E) and ICGR15 (F). ○: NBNC and normal liver; △: HBV and chronic hepatitis; □: HCV and liver cirrhosis.
- Citation: Kawamoto M, Mizuguchi T, Katsuramaki T, Nagayama M, Oshima H, Kawasaki H, Nobuoka T, Kimura Y, Hirata K. Assessment of liver fibrosis by a noninvasive method of transient elastography and biochemical markers. World J Gastroenterol 2006; 12(27): 4325-4330
- URL: https://www.wjgnet.com/1007-9327/full/v12/i27/4325.htm
- DOI: https://dx.doi.org/10.3748/wjg.v12.i27.4325


