Copyright
©2006 Baishideng Publishing Group Co.
World J Gastroenterol. Jan 14, 2006; 12(2): 265-270
Published online Jan 14, 2006. doi: 10.3748/wjg.v12.i2.265
Published online Jan 14, 2006. doi: 10.3748/wjg.v12.i2.265
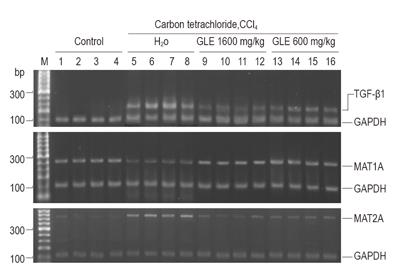
Figure 1 Effect of GLE on mRNA expression of TGF-β1, MAT1A and MAT2A in hepatic tissue.
M: DNA marker
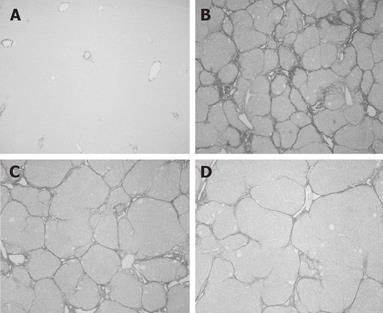
Figure 2 Sirius red staining of rat liver sections.
A: Control; B: CCl4 + H2O, showing micronodular formation and complete septa interconnection with each other; C: CCl4 + GLE (600 mg/kg); D: CCl4 + GLE (1 600 mg/kg), showing a marked reduction in fiber deposition.
-
Citation: Lin WC, Lin WL. Ameliorative effect of
Ganoderma lucidum on carbon tetrachloride-induced liver fibrosis in rats. World J Gastroenterol 2006; 12(2): 265-270 - URL: https://www.wjgnet.com/1007-9327/full/v12/i2/265.htm
- DOI: https://dx.doi.org/10.3748/wjg.v12.i2.265


