Copyright
©2006 Baishideng Publishing Group Co.
World J Gastroenterol. May 21, 2006; 12(19): 3044-3049
Published online May 21, 2006. doi: 10.3748/wjg.v12.i19.3044
Published online May 21, 2006. doi: 10.3748/wjg.v12.i19.3044
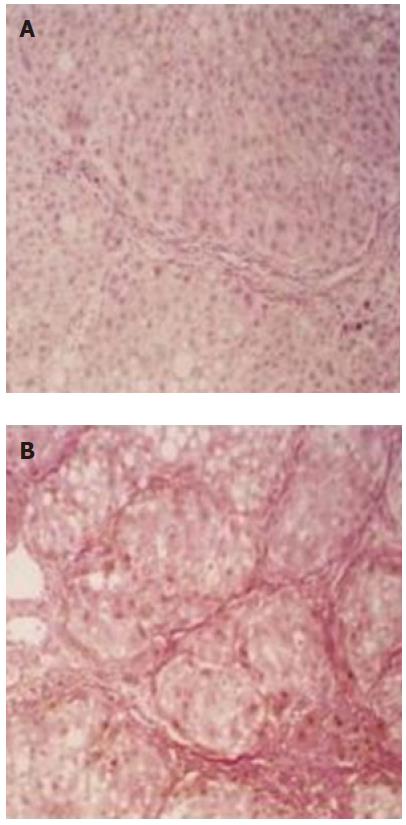
Figure 1 Light microscope observation of rat liver fibrosis (HE ×100).
A: immune-induced liver fibrosis; B: CCl4-induced liver fibrosis.
Figure 2 Histopathological grade of fibrosis of immune induced group.
Figure 3 Histopathological grade of fibrosis of CCL4 induced group.
Figure 4 ELISA results of serum TIMP-1 of immune induced group.
Figure 5 ELISA results of serum TIMP-1 of CCl4 group.
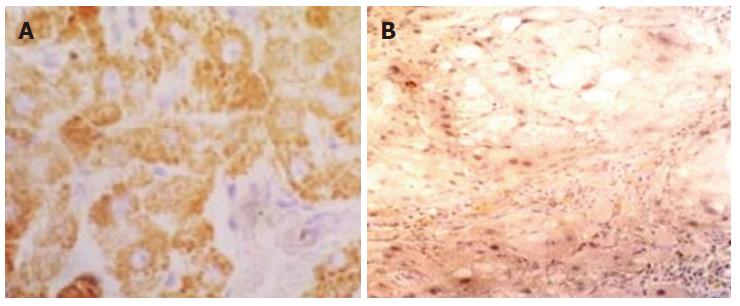
Figure 6 Expression of TIMP-1 mRNA in tissue of rat fibrosis liver.
A: Immune-induced liver fibrosis (× 400); B: CCL4-induced liver fibrosis (× 200).
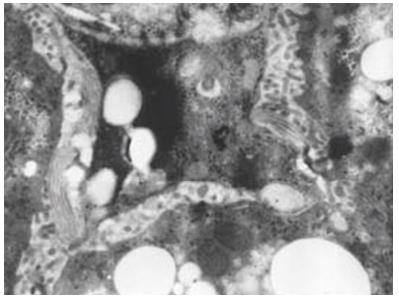
Figure 7 Activated HSC in immune induced rat liver fibrosis (× 10000).
- Citation: Nie QH, Zhang YF, Xie YM, Luo XD, Shao B, Li J, Zhou YX. Correlation between TIMP-1 expression and liver fibrosis in two rat liver fibrosis models. World J Gastroenterol 2006; 12(19): 3044-3049
- URL: https://www.wjgnet.com/1007-9327/full/v12/i19/3044.htm
- DOI: https://dx.doi.org/10.3748/wjg.v12.i19.3044


