Copyright
©2006 Baishideng Publishing Group Co.
World J Gastroenterol. May 7, 2006; 12(17): 2785-2788
Published online May 7, 2006. doi: 10.3748/wjg.v12.i17.2785
Published online May 7, 2006. doi: 10.3748/wjg.v12.i17.2785
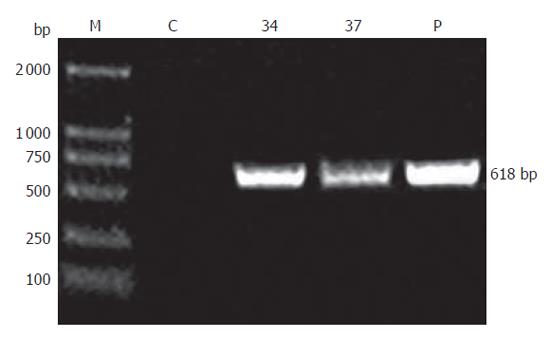
Figure 1 PCR results of transgenic mice.
M: DL 2000 marker; C: Non-transgenic mouse concrol; P: pBC-SV40Tag plasmid; 34 and 37: the number of gene positive mice.
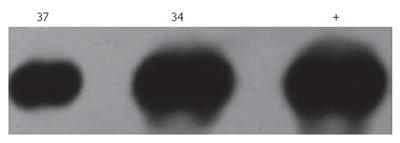
Figure 2 Southern blotting of transgenic mice.
+: pBC-SV40Tag plasmid positive control; 34 and 37: the number of gene positive mice.
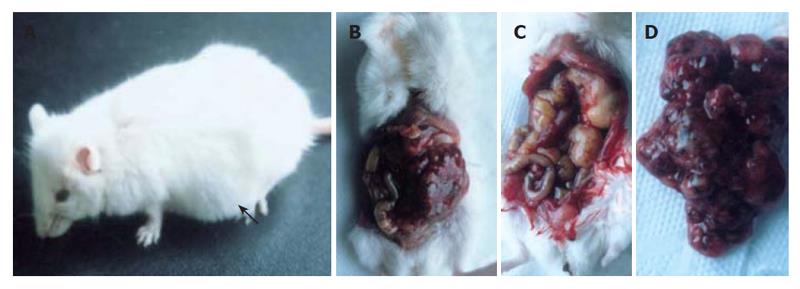
Figure 3 Appearance and anatomy of transgenic mice.
A: Transgenic mice showing ridgy belly (arrowhead); B: Transgenic mice showing a tumor in its abdominal cavity; C and D: Abdominal cavity and tumor excised from the body.
Figure 4 Normal pancreas and tumor tissues-stained with H&E.
A, B and C: Tissue of cystic neoplams from transgenic mice (A: × 100; B: × 200; C: × 400); D: Normal pancreas with islet and acinar cell (× 200).
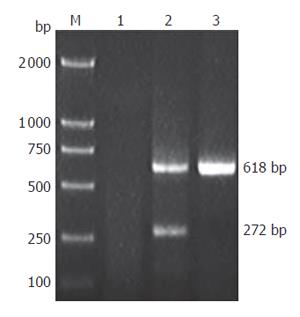
Figure 5 RT-PCR results of transgene expression in tumor.
M: DL-2000 marker, 1: blank control (H2O), 2: cDNA of tumor tissue, 3: negative control (non-reverse transcripted RNA).
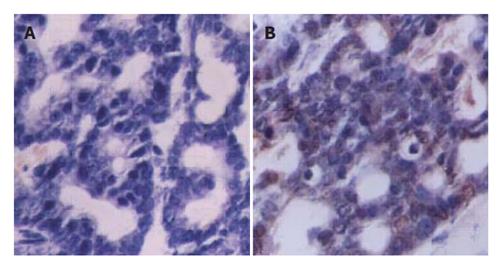
Figure 6 SV40Tag expression in tumor tissue detected by immunohistochemistry without anti-Tag antibody (A) and with anti-Tag antibody (B).
- Citation: Sun Q, Feng J, Wei XL, Zhang R, Dong SZ, Shen Q, Dong J, Li HD, Hu YH. Generation and characterization of a transgenic mouse model for pancreatic cancer. World J Gastroenterol 2006; 12(17): 2785-2788
- URL: https://www.wjgnet.com/1007-9327/full/v12/i17/2785.htm
- DOI: https://dx.doi.org/10.3748/wjg.v12.i17.2785


