Copyright
©2006 Baishideng Publishing Group Co.
World J Gastroenterol. Apr 7, 2006; 12(13): 2125-2129
Published online Apr 7, 2006. doi: 10.3748/wjg.v12.i13.2125
Published online Apr 7, 2006. doi: 10.3748/wjg.v12.i13.2125
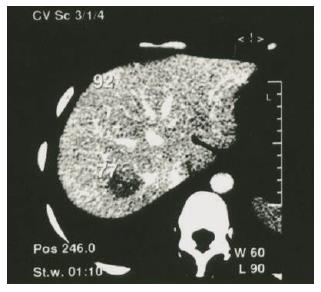
Figure 1 CT scanning showing a lesion with reduction of density in the posterior part of the right lobe of liver.
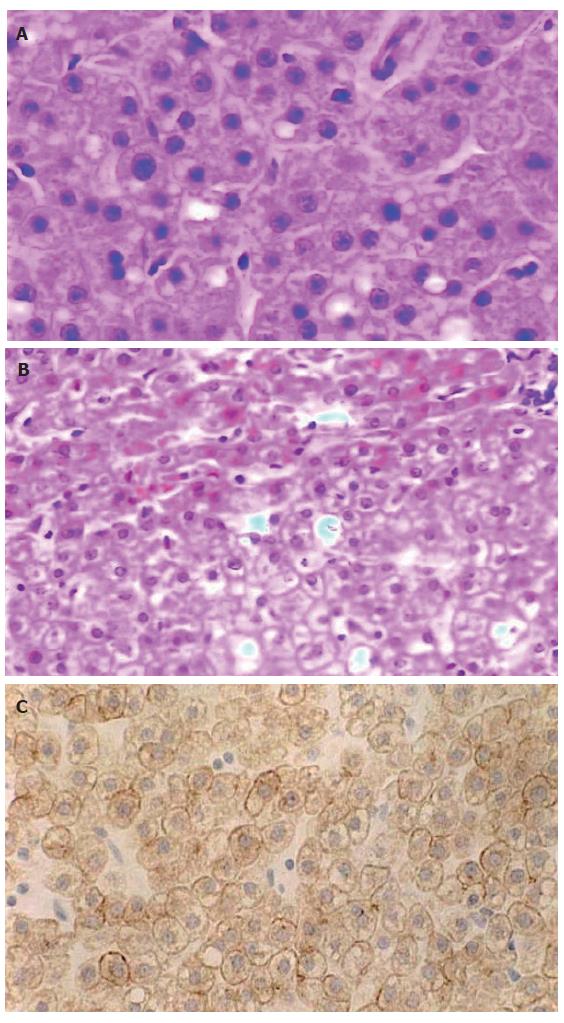
Figure 2 Liver cell adenoma (× 400).
A: Similar to normal hepatocytes, arranged in two-cell-thick cords separated by hepatic sinusoids (HE); B: Showing the border between LCA (lower) and surrounding liver parenchyma (upper) (HE); C: CK18 immunoreactivity (S-P).
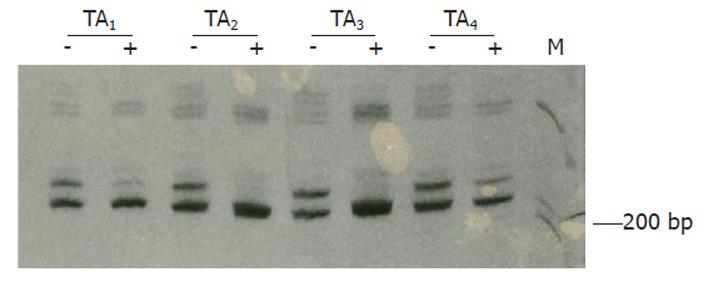
Figure 3 Clonal analysis on tissues from 4 tumor areas (TAs).
The pretreatment with Hha I results in loss of the upper band for TA2 and TA3, and intensity reduction by factors of 71.8% and 57.1% for TA1 and TA4, respectively. +, with Hha I pretreatment; -, without Hha I treatment.
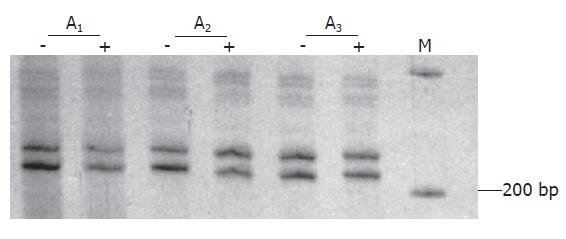
Figure 4 Data of clonality test of three areas of liver parenchymal tissues (A1-A3).
Neither of the bands on gel shows marked intensity change for the samples pretreated with Hha I (+) compared to those not treated (-).
- Citation: Gong L, Su Q, Zhang W, Li AN, Zhu SJ, Feng YM. Liver cell adenoma: A case report with clonal analysis and literature review. World J Gastroenterol 2006; 12(13): 2125-2129
- URL: https://www.wjgnet.com/1007-9327/full/v12/i13/2125.htm
- DOI: https://dx.doi.org/10.3748/wjg.v12.i13.2125


