Copyright
©2006 Baishideng Publishing Group Co.
World J Gastroenterol. Apr 7, 2006; 12(13): 2047-2052
Published online Apr 7, 2006. doi: 10.3748/wjg.v12.i13.2047
Published online Apr 7, 2006. doi: 10.3748/wjg.v12.i13.2047
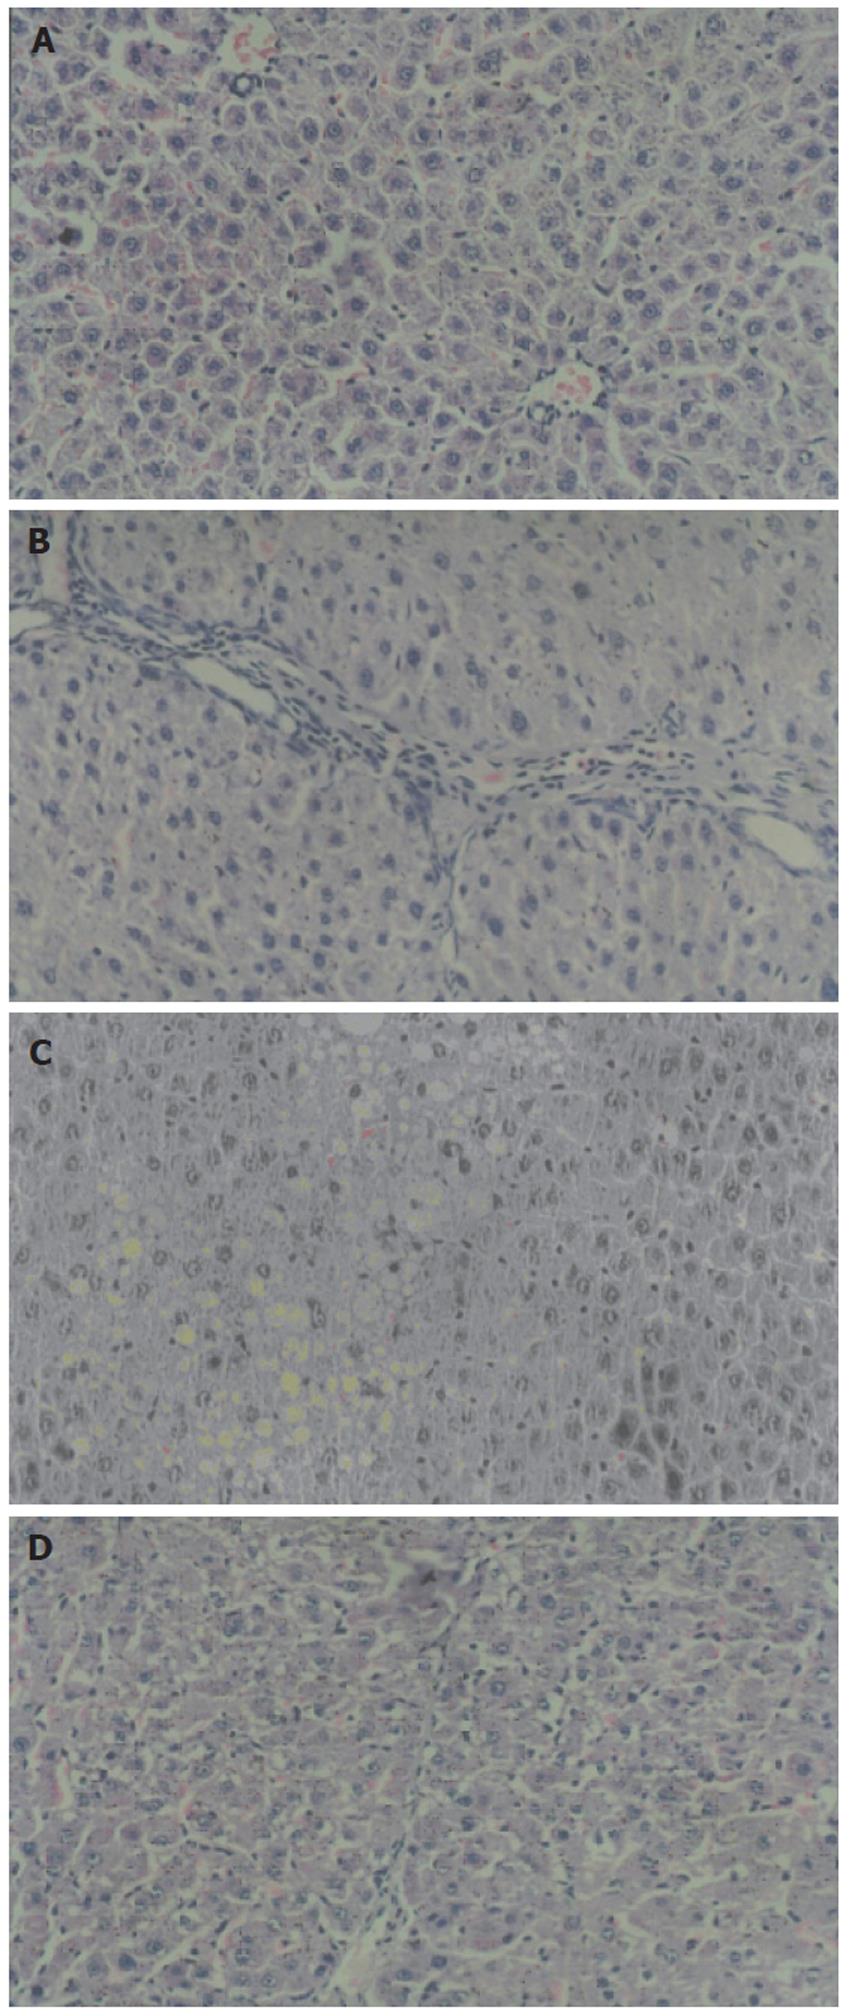
Figure 1 Analysis of liver pathology of each group (HE×200).
A: normal group; B: model group; C: CCl4 group; D: high dose group.
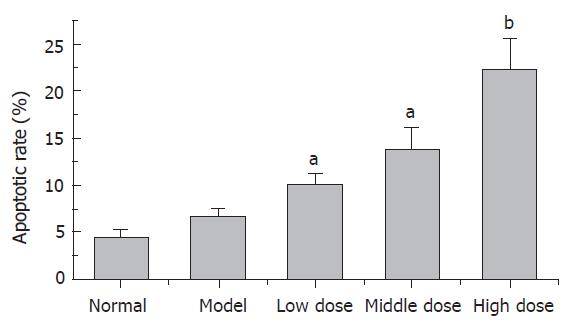
Figure 2 QGHXF induced apoptotic rate of HSC (n = 6, mean ± SD).
There were significant differences between model group and QGHXF groups. aP < 0.05 vs model group. bP < 0.01 vs model group.
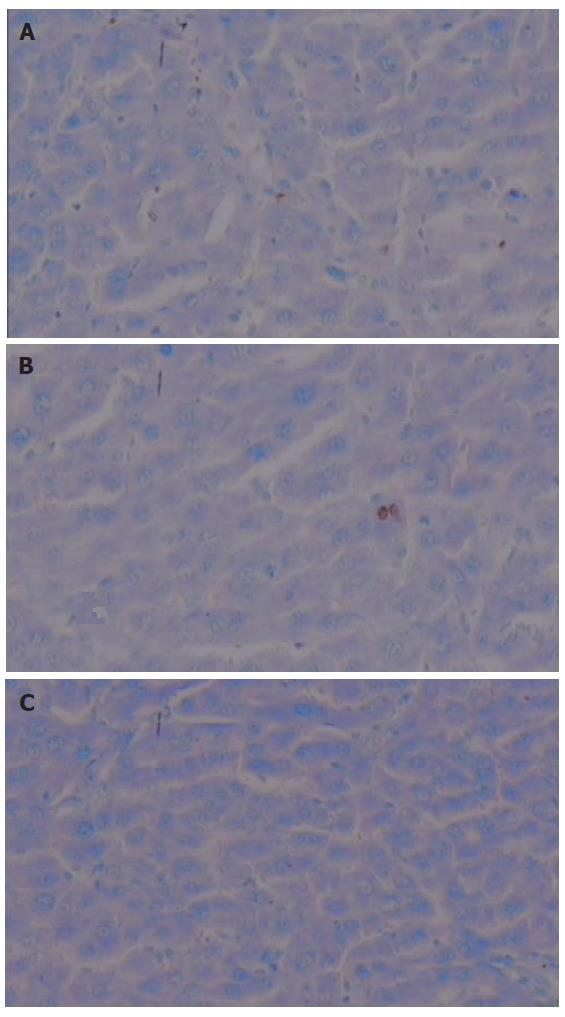
Figure 3 TUNEL assay of each group.
A: High dose; B: Model; C: Normal; Counterstained with hematoxylin ( original magnification, ×400).
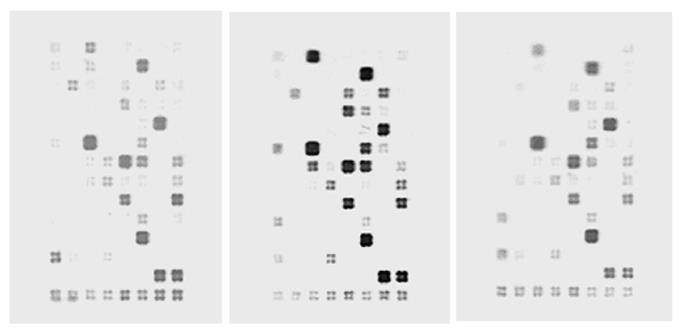
Figure 4 Gene expression profile of each group.
- Citation: Ji G, Wang L, Zhang SH, Liu JW, Zheng PY, Liu T. Effect of Chinese medicine Qinggan Huoxuefang on inducing HSC apoptosis in alcoholic liver fibrosis rats. World J Gastroenterol 2006; 12(13): 2047-2052
- URL: https://www.wjgnet.com/1007-9327/full/v12/i13/2047.htm
- DOI: https://dx.doi.org/10.3748/wjg.v12.i13.2047


