Copyright
©2006 Baishideng Publishing Group Co.
World J Gastroenterol. Apr 7, 2006; 12(13): 2016-2023
Published online Apr 7, 2006. doi: 10.3748/wjg.v12.i13.2016
Published online Apr 7, 2006. doi: 10.3748/wjg.v12.i13.2016
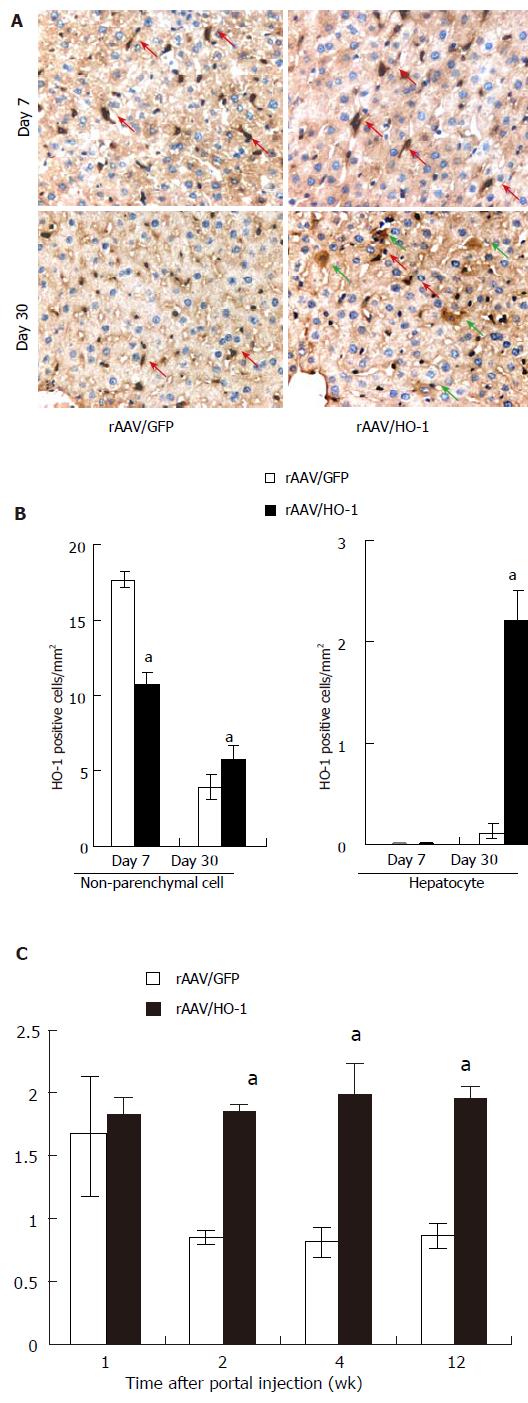
Figure 1 A: The expression patterns of HO-1 in the livers after portal injection of rAAV/HO-1 in LEW rats.
Red arrow indicated the HO-1-positive non-parenchymal cells; green arrow indicated the hepatocyte; B: The quantification of the HO-1 positive cells in the liver after administration of rAAV/HO-1. Data were presented as number of HO-1 positive cells per mm2; n = 3-5, mean ± SE, aP<0.05; C: The HO enzymatic activity of rAAV/GFP or rAAV/HO-1 transduced livers. The data were demonstrated as the amount of generated bilirubin of microsomal protein from liver tissues and were shown as the fold changes over the normal rat liver, mean ± SE, n = 3, aP < 0.05.
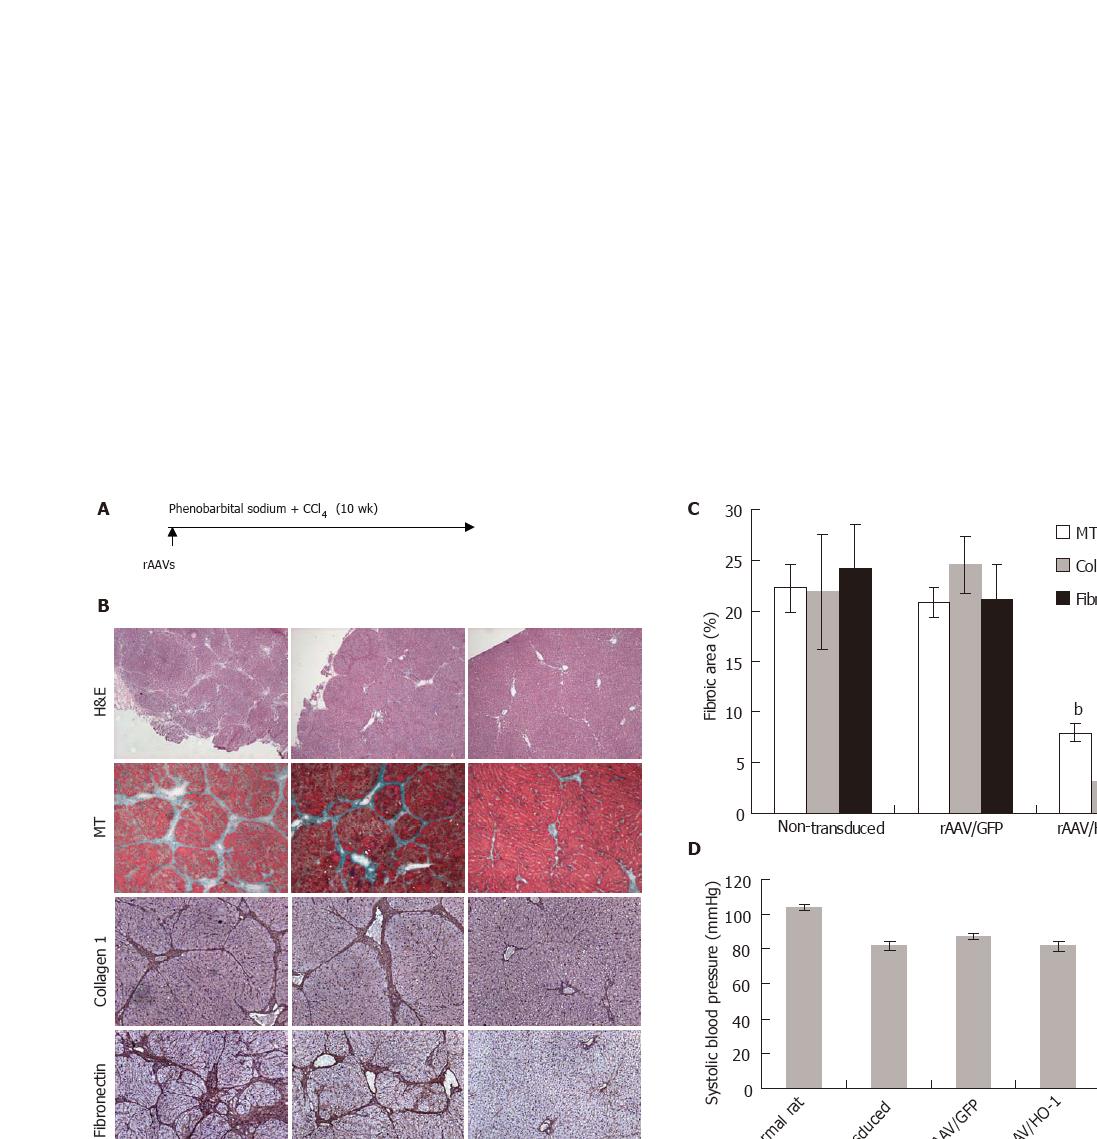
Figure 2 A: The model to induce micronodular cirrhosis in LEW rat.
The rAAVs were injected through the portal vein shortly before the induction; B: The histology and immunohistochemistry of the livers with or without treatment at the 10th week (H-E, original magnification ×40; MT: Masson’s trichrome stiaining, the fibrotic elements were stained in green, original 100×; collagen 1 and fibronectin staining, original magnification ×100); C: The measurement of fibrotic area in the livers at the 10th week by the computer software as described in Materials & Methods. Data were shown as mean±SE, n = 5, bP < 0.001; D and E: The systolic and portal pressure of rats after induction of liver cirrhosis with or without treatments. The data were shown as mean±SE, n = 10, dP < 0.001.
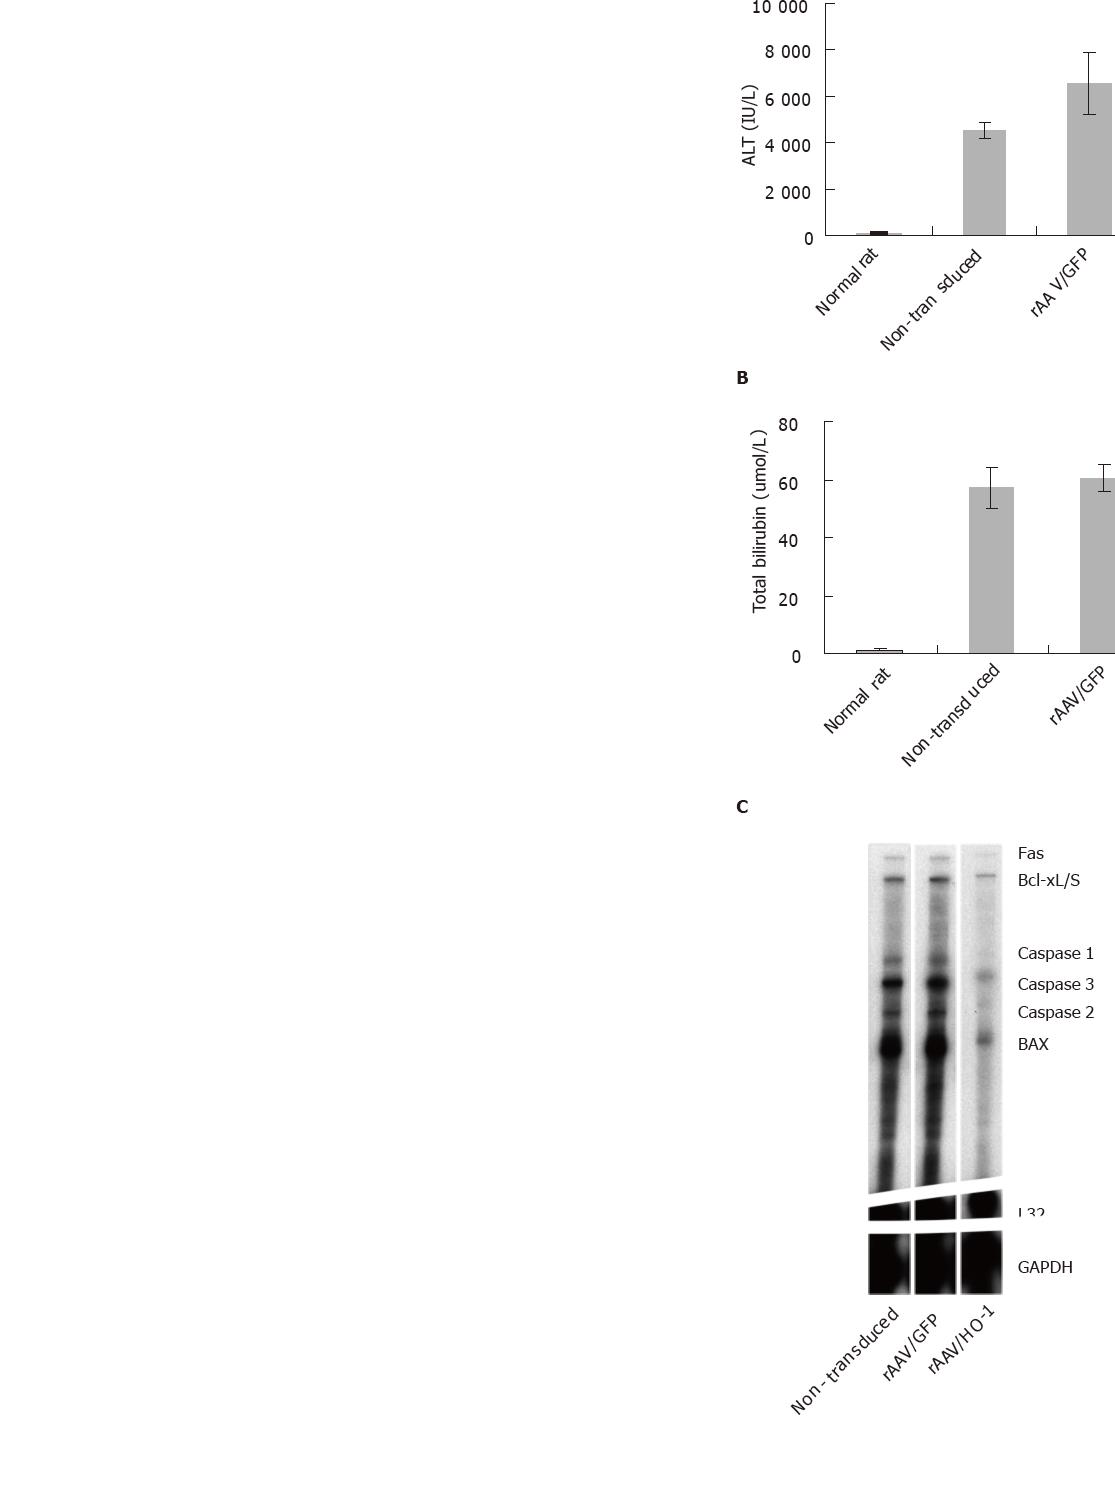
Figure 3 A and B: The liver function of rats with or with treatment under long-term CCl4 toxicity was presented by the determination of plasma ALT and total bilirubin level.
The data was shown as mean±SEM, n = 5-10, aP<0.001; C and D: The representative picture of the expression patterns of apoptotic genes in the livers at the 10th week. The mRNA level of genes was detected by RNase protection assay. The quantification of the expression level was measured by phosphoimager as described in Materials & Methods. The data were shown as mean ± SE, n = 3-5, bP<0.05; E: The ATP level of the livers of rats with or without treatments at the 10th wk, n = 5-10, dP<0.001.
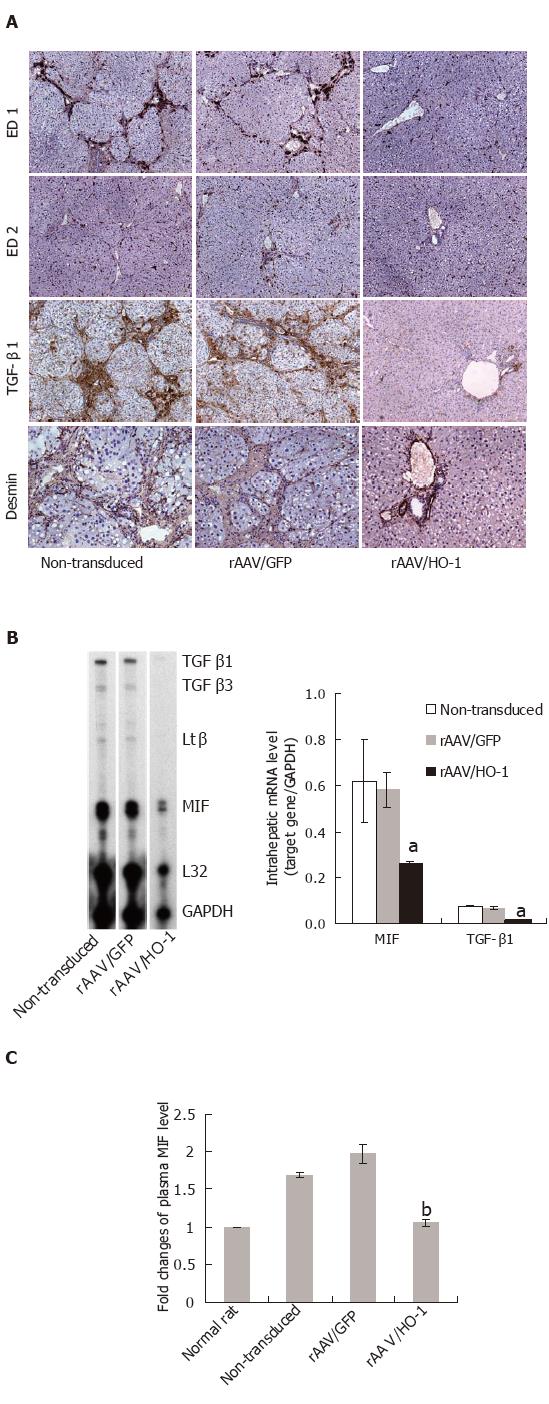
Figure 4 A: The representative pictures of pro-inflammatory and pro-fibrogenic responses in the livers of rats with or without treatment at the 10th week.
Infiltrating macrophage (ED1), tissue residential macrophages (ED2), TGF-β1, and activated hepatic stellate cells (desmin) were detected by immunohistochemistry; original magnification, ×100; B: The profile of pro-inflammatory and profibrogenic cytokine expression. The level of mRNA was detected by RNase protection assay and was quantified by phosphoimager, n = 3-5, aP<0.05; C: The plasma level of macrophage migration inhibitory factor (MIF) was detected by ELISA. The data were shown as fold changes of over the level in normal rat, n = 3-5, bP < 0.001.
- Citation: Tsui TY, Lau CK, Ma J, Glockzin G, Obed A, Schlitt HJ, Fan ST. Adeno-associated virus-mediated heme oxygenase-1 gene transfer suppresses the progression of micronodular cirrhosis in rats. World J Gastroenterol 2006; 12(13): 2016-2023
- URL: https://www.wjgnet.com/1007-9327/full/v12/i13/2016.htm
- DOI: https://dx.doi.org/10.3748/wjg.v12.i13.2016


