Copyright
©2006 Baishideng Publishing Group Co.
World J Gastroenterol. Mar 14, 2006; 12(10): 1558-1568
Published online Mar 14, 2006. doi: 10.3748/wjg.v12.i10.1558
Published online Mar 14, 2006. doi: 10.3748/wjg.v12.i10.1558
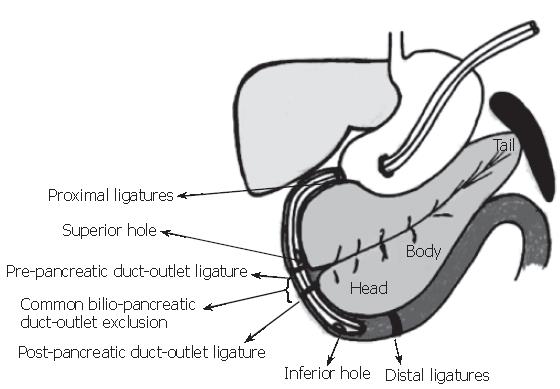
Figure 1 BPDOE-CDL model to trigger acute pancreatitis.
Two closed-duodenal-loops were created in such a way that the entrance of the common bilio-pancreatic duct-outlet was absolutely excluded. To double check the absence of duodenal-reflux content or duodenal leakage, methylene blue was added to the sodium tauracholate which was instilled into the peri-vaterian duodenum through the superior and inferior holes (reproduced with permission granted by the Journal of Pancreatology and S. Karger AG, Basel)[6].
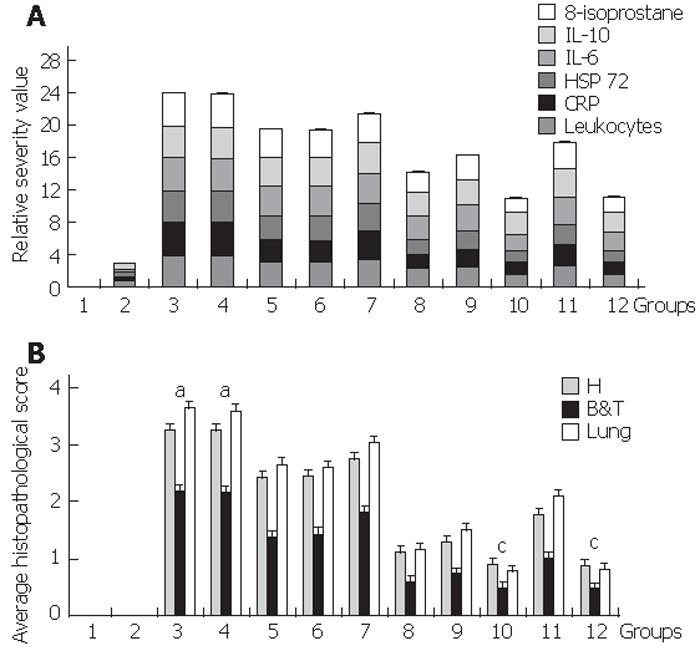
Figure 2 Relative severity value in blood and average histopathological score.
A: Relative severity value in blood. To visualize the severity degree based on biochemical assays in blood, we arbitrarily established a single “relative severity value” of zero to group 1 (reference baseline value) and of four to group 3 (AP) per assay. To calculate the single “relative severity value” for the rest of the groups we used the following formula: “relative severity value” = [( X – reference baseline value) / ( AP value – reference baseline value )] x 4. Introducing each mean value from table 2 (referred to in the above formula as X) we obtained six different single “relative severity values” for each group, whose contribution to the total “relative severity value” is shown in this graph. For those values in table 2 that were below the detection limit, the value assigned to X corresponded to that of the assay’s sensitivity (IL-6: 112 pg/mL; IL-10: 12 pg/mL). Homogenous Groups are 1-2-(12-10)-8-9-11-(5-6-7)-(3-4), P<0.05. Results are shown as mean ± SD. B: Average histopathological score. To visualize the severity degree based on the score-associated to histopathological lesions, we averaged the means of the six parameters used in table 4 for each group. Homogenous groups are 1-2-(12-10)-8-9-11-(5-6-7)-(3-4), P < 0.05. There was a significant increase in the assessed parameters for Groups 3&4 that developed severe AP aP < 0.03 while groups 10& 12 exhibited a significant improvement cP < 0.05 Results shown as mean ± SD.
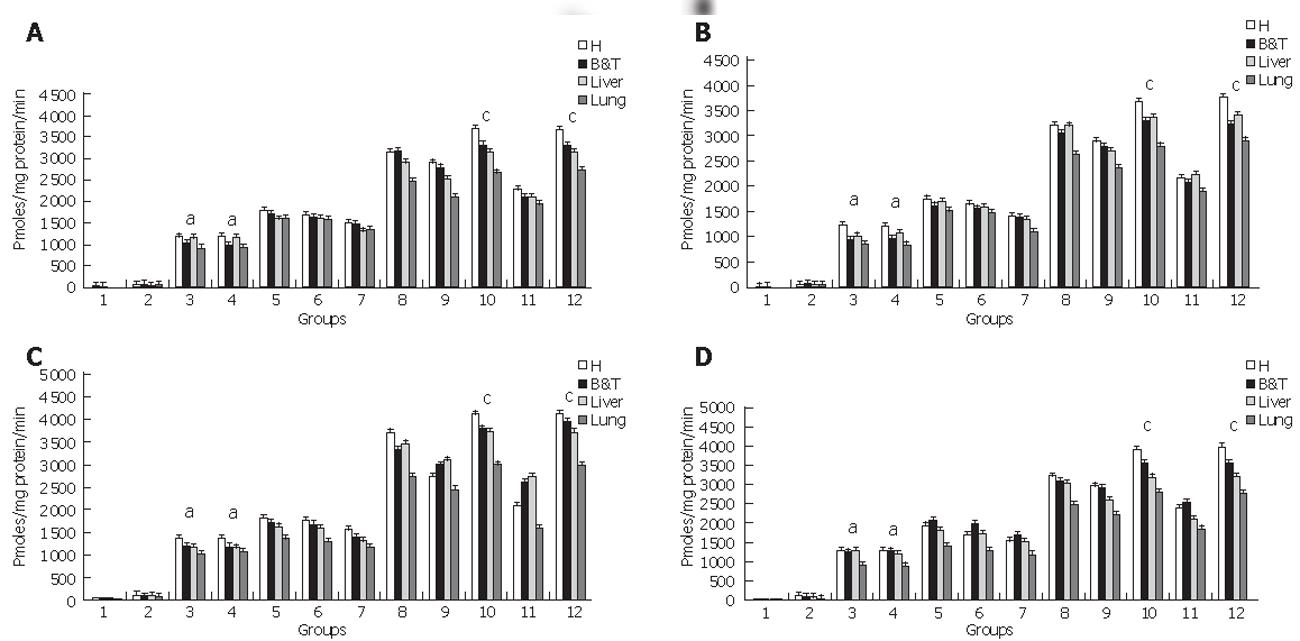
Figure 3 Caspase Activities.
A: Caspase 2 activity was measured to evaluate the upstream activation of the intrinsic apoptotic pathway. Groups 10&12 presented a significant activation cP < 0.05 which was reduced for groups 3&4 aP < 0.05. Homogenous groups for caspase 2 activity are: 1-2-(12-10)-8-9-11-(5-6-7)-(3-4), P < 0.05. H: pancreatic head, B&T: pancreatic body and tail. B: Caspase 3 Activity was measured to evaluate the activation of the executor caspase 3. Groups 10&12 presented a significant activation cP < 0.05 which was reduced for groups 3&4 aP < 0.05. Homogenous groups for caspase 2 activity are: 1-2-(12-10)-8-9-11-(5-6-7)-(3-4), P < 0.05. H: pancreatic head, B&T: pancreatic body and tail. C: Caspase 8 Activity was measured to evaluate the activation of the initiator caspase 8. groups 10&12 presented a significant activation cP < 0.05 which was reduced for groups 3&4 aP < 0.05. Homogenous groups for caspase 8 activity are: 1-2-(12-10)-8-9-11-(5-6-7)-(3-4), P < 0.05. H: pancreatic head, B&T: pancreatic body and tail. Results shown as mean ± SD. D: Caspase 9 Activity was measured to evaluate the activation of the intrinsic pathway .Groups 10&12 presented a significant activation cP < 0.05 which was reduced for groups 3&4 aP < 0.05. Homogenous groups for caspase 9 activity are: 1-2-(12-10)-8-9-11-(5-6-7)-(3-4), P < 0.05. H: pancreatic head, B&T: pancreatic body and tail. Results are shown as mean ± SD.
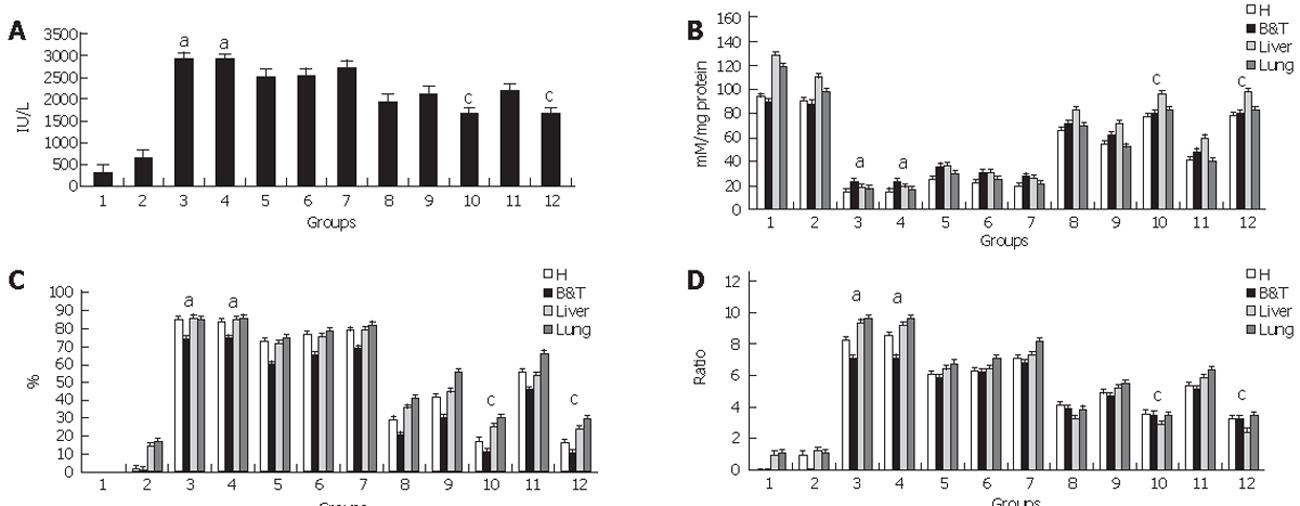
Figure 4 Apoptosis versus necrosis.
A: Blood lactate dehydrogenase. As a marker of cellular injury and death significant high blood levels of LDH for groups 3&4 aP < 0.005 reflected the undergoing severe AP while groups 10&12 presented a significant reduction in the enzyme value cP < 0.005. Homogenous. Groups for LDH are:1-2-(12-10)-8-9-11-(5-6-7)-(3-4), P < 0.005. B-D: ATP concentration. The significant decrease in ATP concentration that surpassed the 80% loss for groups 3&4 aP<0.005,is the hallmark of the necrotic process that is being developed while groups 10&12 that underwent apoptosis did not manifest such extreme values cP<0.005. This expression in the nucleotide levels is translated into the ADP/ATP ratio that is significantly increased aP<0.01 for groups 3&4 that underwent necrosis while groups 10&12 that underwent apoptosis had significantly lower values cP<0.05. Homogenous Groups are: 1-2-(12-10)-8-9-11-(5-6-7)-(3-4), P<0.005. Results are shown as mean ± SD.
- Citation: Cosen-Binker LI, Binker MG, Cosen R, Negri G, Tiscornia O. Relaxin prevents the development of severe acute pancreatitis. World J Gastroenterol 2006; 12(10): 1558-1568
- URL: https://www.wjgnet.com/1007-9327/full/v12/i10/1558.htm
- DOI: https://dx.doi.org/10.3748/wjg.v12.i10.1558


