Copyright
©2006 Baishideng Publishing Group Co.
World J Gastroenterol. Mar 14, 2006; 12(10): 1558-1568
Published online Mar 14, 2006. doi: 10.3748/wjg.v12.i10.1558
Published online Mar 14, 2006. doi: 10.3748/wjg.v12.i10.1558
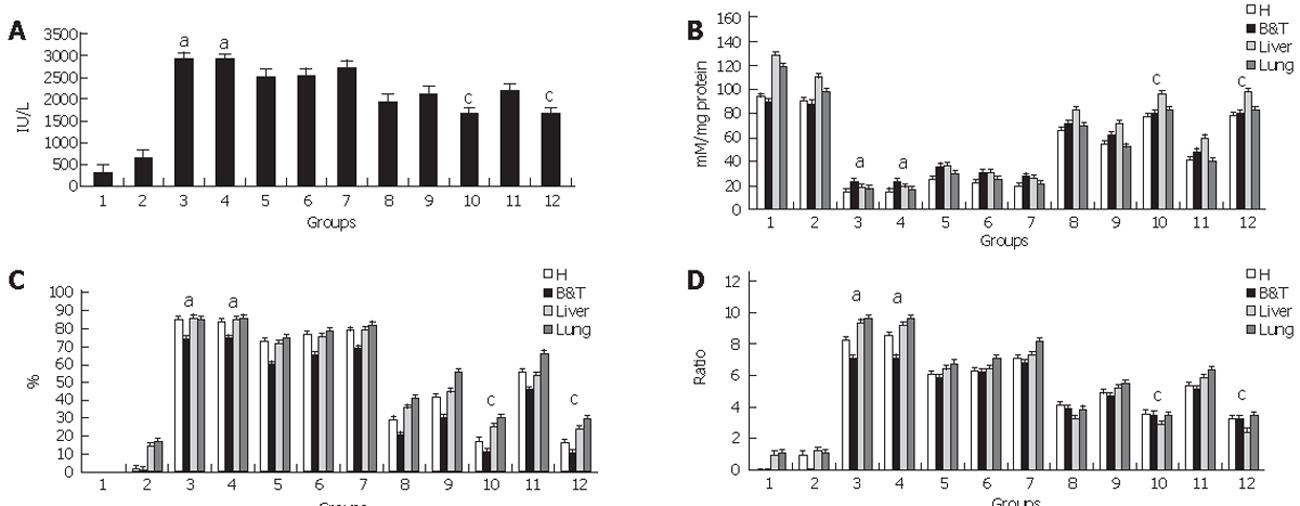
Figure 4 Apoptosis versus necrosis.
A: Blood lactate dehydrogenase. As a marker of cellular injury and death significant high blood levels of LDH for groups 3&4 aP < 0.005 reflected the undergoing severe AP while groups 10&12 presented a significant reduction in the enzyme value cP < 0.005. Homogenous. Groups for LDH are:1-2-(12-10)-8-9-11-(5-6-7)-(3-4), P < 0.005. B-D: ATP concentration. The significant decrease in ATP concentration that surpassed the 80% loss for groups 3&4 aP<0.005,is the hallmark of the necrotic process that is being developed while groups 10&12 that underwent apoptosis did not manifest such extreme values cP<0.005. This expression in the nucleotide levels is translated into the ADP/ATP ratio that is significantly increased aP<0.01 for groups 3&4 that underwent necrosis while groups 10&12 that underwent apoptosis had significantly lower values cP<0.05. Homogenous Groups are: 1-2-(12-10)-8-9-11-(5-6-7)-(3-4), P<0.005. Results are shown as mean ± SD.
- Citation: Cosen-Binker LI, Binker MG, Cosen R, Negri G, Tiscornia O. Relaxin prevents the development of severe acute pancreatitis. World J Gastroenterol 2006; 12(10): 1558-1568
- URL: https://www.wjgnet.com/1007-9327/full/v12/i10/1558.htm
- DOI: https://dx.doi.org/10.3748/wjg.v12.i10.1558


