Copyright
©2005 Baishideng Publishing Group Inc.
World J Gastroenterol. Feb 28, 2005; 11(8): 1245-1247
Published online Feb 28, 2005. doi: 10.3748/wjg.v11.i8.1245
Published online Feb 28, 2005. doi: 10.3748/wjg.v11.i8.1245
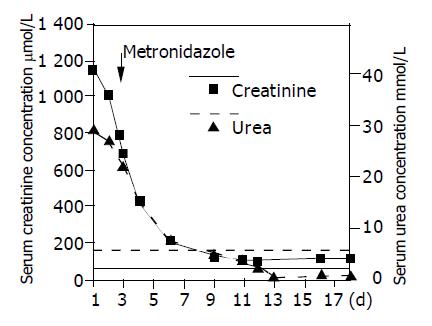
Figure 1 Serum urea (----) and creatinine (—) levels over time of hospital stay with the horizontal lines representing normal ranges of urea (----) and creatinine (—).
The arrow indicates start of specific antibiotic treatment.
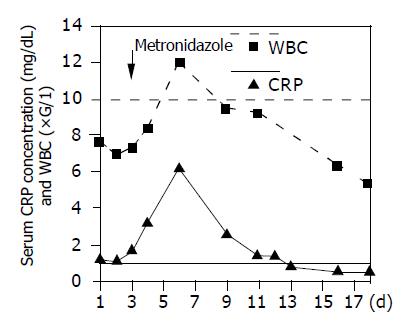
Figure 2 White blood cell count (----) and serum CRP levels (—) over time of hospital stay with horizontal lines representing normal ranges of white blood cell count (----) and CRP (—).
The arrow indicates start of specific antibiotic treatment.
-
Citation: Arrich J, Sodeck GH, Sengölge G, Konnaris C, Müllner M, Laggner AN, Domanovits H.
Clostridium difficile causing acute renal failure: Case presentation and review. World J Gastroenterol 2005; 11(8): 1245-1247 - URL: https://www.wjgnet.com/1007-9327/full/v11/i8/1245.htm
- DOI: https://dx.doi.org/10.3748/wjg.v11.i8.1245


