Copyright
©2005 Baishideng Publishing Group Inc.
World J Gastroenterol. Feb 21, 2005; 11(7): 954-959
Published online Feb 21, 2005. doi: 10.3748/wjg.v11.i7.954
Published online Feb 21, 2005. doi: 10.3748/wjg.v11.i7.954
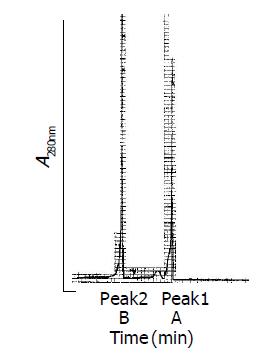
Figure 1 Elution profile of rHDL-ACM on SephadexG-25.
Flow rate, 30 mL/h. Elution solution:0.15 mol/L NaCl, 1 mmol/L EDTA, 0.02% NaN3, pH 6.5. A: rHDL-ACM before dialysis against 0.15 mol/L NaCl, 1 mmol/L EDTA, 0.02% NaN3, pH 6.5 Peak 1: rHDL-ACM, Peak 2: fACM; B: rHDL-ACM after dialysis against 0.15 mol/L NaCl, 1 mmol/L EDTA, 0.02% NaN3, pH 6.5.
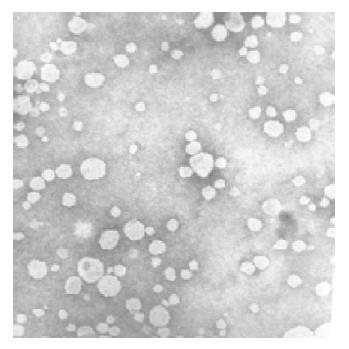
Figure 2 Electron micrograph of rHDL-ACM.
rHDL-ACM preparation was negatively stained with 1% sodium phosphotungstate pH 7.4. Bar marker represents 200 nm. (×52 K).
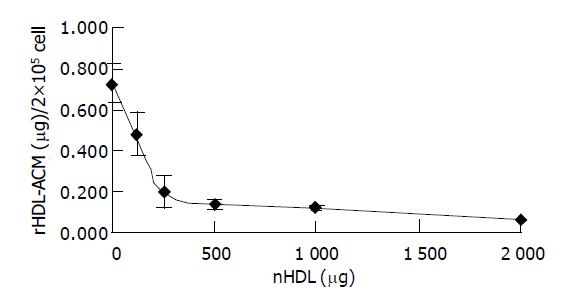
Figure 3 Competitive binding of rHDL-ACM to SMMC-7721 cells in the presence of excess native HDL.
Incubation was carried out at 37 °C for 3 h, at native human plasma HDL concentrations ranging from 0 to 2000 µg/2×105 cell.
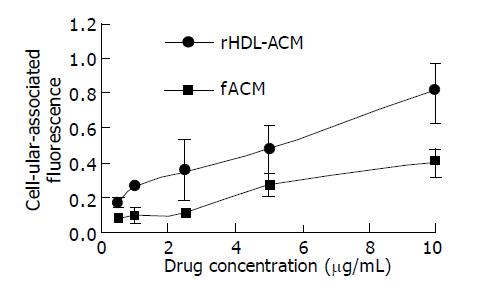
Figure 4 Cellular-uptake of rHDL-ACM and free ACM (fACM) by SMMC-7721 cells (n = 3).
Incubation was carried out at 37 °C for 24 h. Drug concentration indicates ACM concentration in the medium.
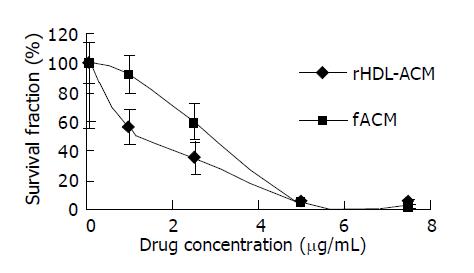
Figure 5 Cytotoxicity of rHDL-ACM and fACM against SMMC-7721 cells (n = 3).
Drug concentration indicates ACM concentration in the medium.
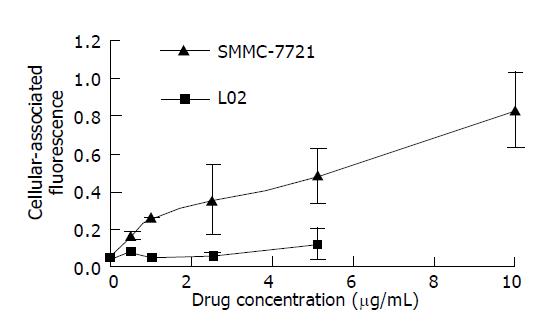
Figure 6 Cellular-uptake of rHDL-ACM by SMMC-7721 cells and L02 cells (n = 3) Incubation was carried out at 37 °C for 24 h.
Drug concentration indicates ACM concentration in the medium.
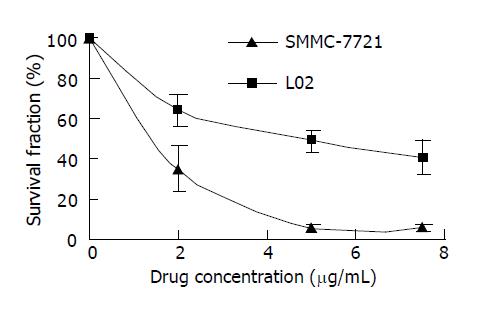
Figure 7 Cytotoxicity of rHDL-ACM against SMMC-7721 and L02 cells (n = 3).
Drug concentration indicates ACM concentration in the medium.
- Citation: Lou B, Liao XL, Wu MP, Cheng PF, Yin CY, Fei Z. High-density lipoprotein as a potential carrier for delivery of a lipophilic antitumoral drug into hepatoma cells. World J Gastroenterol 2005; 11(7): 954-959
- URL: https://www.wjgnet.com/1007-9327/full/v11/i7/954.htm
- DOI: https://dx.doi.org/10.3748/wjg.v11.i7.954


