Copyright
©2005 Baishideng Publishing Group Inc.
World J Gastroenterol. Feb 21, 2005; 11(7): 1060-1064
Published online Feb 21, 2005. doi: 10.3748/wjg.v11.i7.1060
Published online Feb 21, 2005. doi: 10.3748/wjg.v11.i7.1060
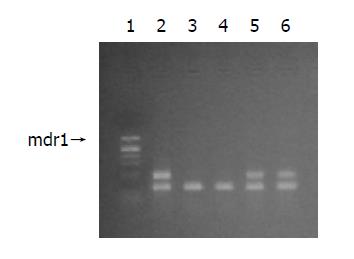
Figure 1 mdr1 mRNA expression of tumors from three patients.
Lane 1: DNA marker, lane 2: positive control, lane 3: negative control, lane 4: patient III, lane 5: patient I, lane 6: patient II.
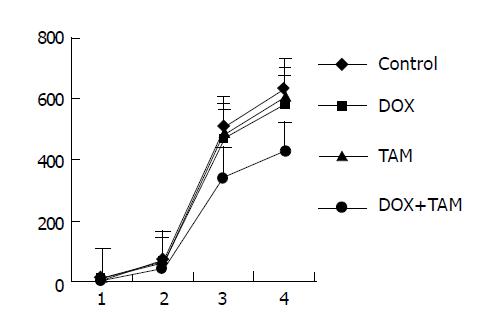
Figure 2 The volumes and weights of mdr1-positive and ER-positive tumors, 1: the tumor volumes in the beginning of treatment, 2: the tumor volumes at the end of the first course, 3: the tumor volumes at the end of the second course, 4: the tumor weights at the end of the second course.
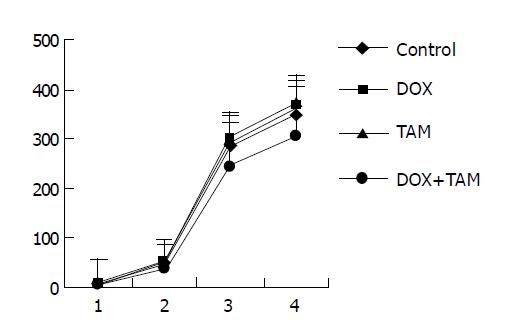
Figure 3 The volumes and weights of mdr1-positive and ER-negative tumors, 1: the tumor volumes in the beginning of treatment, 2: the tumor volumes by the end of the first course, 3: the tumor volumes at the end of the second course, 4: the tumor weights at the end of the second course.
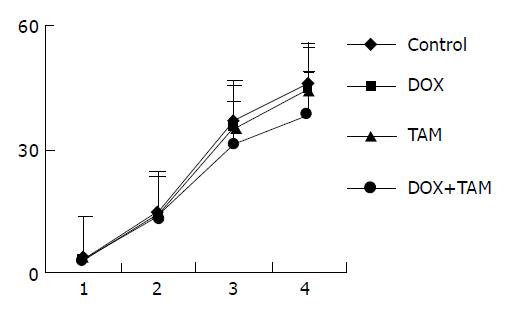
Figure 4 The volumes and weights of mdr1 negative tumors, 1: the tumor volumes in the beginning of treatment, 2: the tumor volumes at the end of the first course, 3: the tumor volumes at the end of the second course, 4: the tumor weights at the end of the second course.
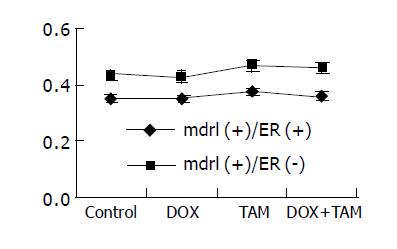
Figure 5 mdr1 mRNA levels of mdr1-positive tumors after treatment.
-
Citation: Shen LZ, Hua YB, Yu XM, Xu Q, Chen T, Wang JH, Wu WX. Tamoxifen can reverse multidrug resistance of colorectal carcinoma
in vivo . World J Gastroenterol 2005; 11(7): 1060-1064 - URL: https://www.wjgnet.com/1007-9327/full/v11/i7/1060.htm
- DOI: https://dx.doi.org/10.3748/wjg.v11.i7.1060


