Copyright
©2005 Baishideng Publishing Group Inc.
World J Gastroenterol. Feb 14, 2005; 11(6): 899-902
Published online Feb 14, 2005. doi: 10.3748/wjg.v11.i6.899
Published online Feb 14, 2005. doi: 10.3748/wjg.v11.i6.899
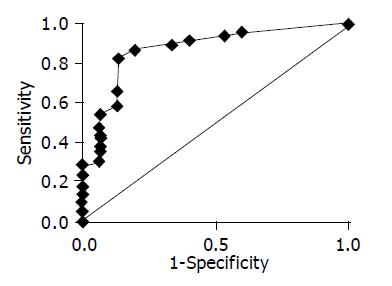
Figure 1 ROC curve of PE group determined by MELD model, area under the broken line is 0.
5 standing for no discrimination.
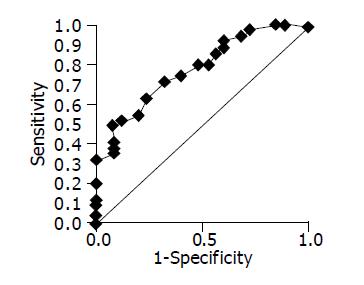
Figure 2 ROC curve of PE group determined by MELD model, area under the broken line is 0.
5 standing for no discrimination.
- Citation: Weng ZH, Cai SQ. Analysis of prognosis on patients with severe viral hepatitis using the model for end-stage liver disease. World J Gastroenterol 2005; 11(6): 899-902
- URL: https://www.wjgnet.com/1007-9327/full/v11/i6/899.htm
- DOI: https://dx.doi.org/10.3748/wjg.v11.i6.899


