Copyright
©2005 Baishideng Publishing Group Inc.
World J Gastroenterol. Feb 14, 2005; 11(6): 890-894
Published online Feb 14, 2005. doi: 10.3748/wjg.v11.i6.890
Published online Feb 14, 2005. doi: 10.3748/wjg.v11.i6.890
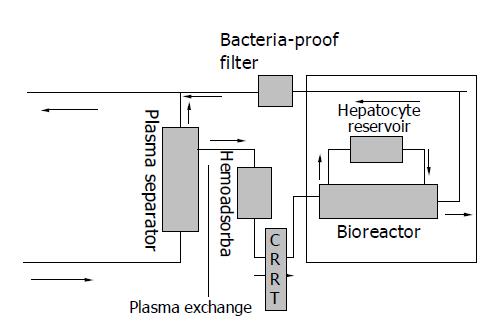
Figure 1 Schematic diagram of HALSS.
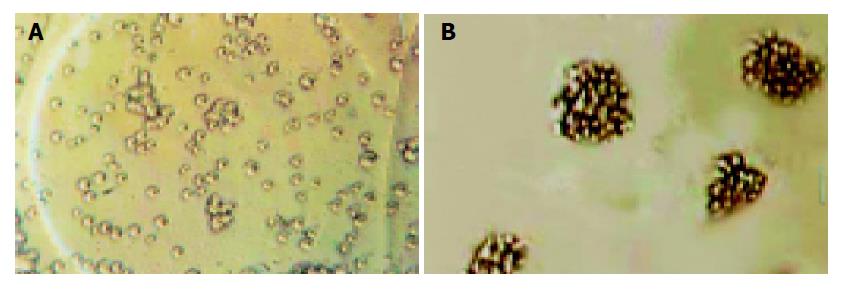
Figure 2 Morphology of hepatocytes.
A: freshly isolated single hepatocytes stained with trypan blue (×200); B: spheroid formation after 24 h of spheroid culture (×100).
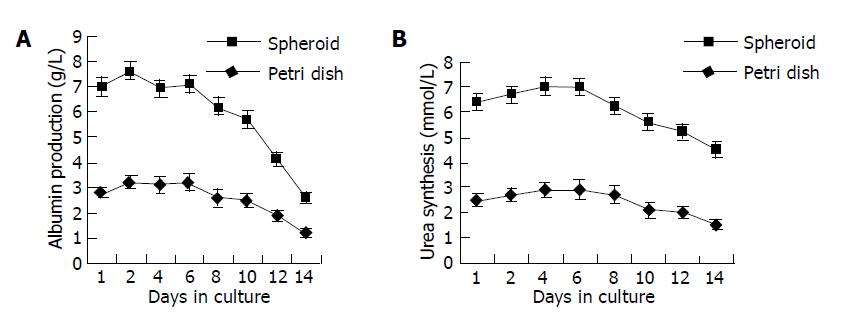
Figure 3 Spheroid cultivation of hepatocytes at a density of 5×10⁶/mL cells.
Control hepatocytes were cultivated in a petri dish at the same density. A: albumin production; B: urea synthesis.
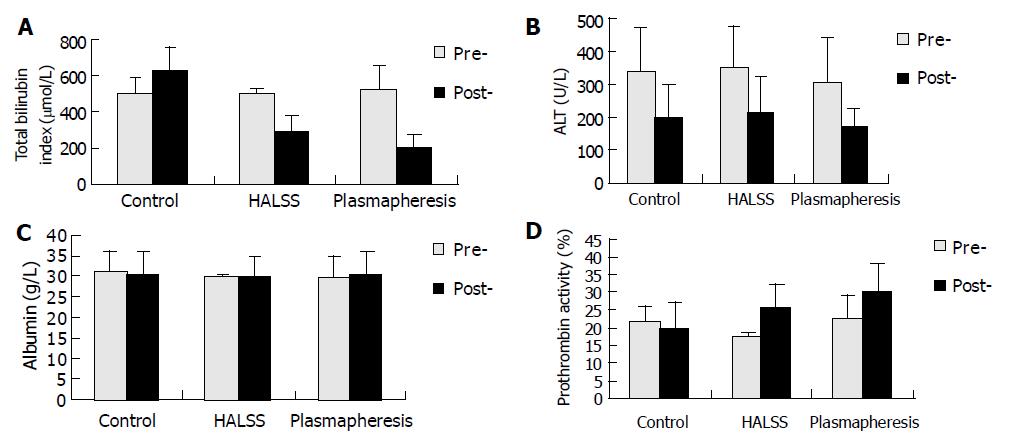
Figure 4 Changes of total bilirubin, ALT, albumin and PTA index in patients in HALSS group, Plasmapheresis group and control group.
Pre-: index before treatment. Post-: index at two weeks after treatment.
- Citation: Gan JH, Zhou XQ, Qin AL, Luo EP, Zhao WF, Yu H, Xu J. Hybrid artificial liver support system for treatment of severe liver failure. World J Gastroenterol 2005; 11(6): 890-894
- URL: https://www.wjgnet.com/1007-9327/full/v11/i6/890.htm
- DOI: https://dx.doi.org/10.3748/wjg.v11.i6.890


