Copyright
©2005 Baishideng Publishing Group Inc.
World J Gastroenterol. Feb 14, 2005; 11(6): 817-822
Published online Feb 14, 2005. doi: 10.3748/wjg.v11.i6.817
Published online Feb 14, 2005. doi: 10.3748/wjg.v11.i6.817
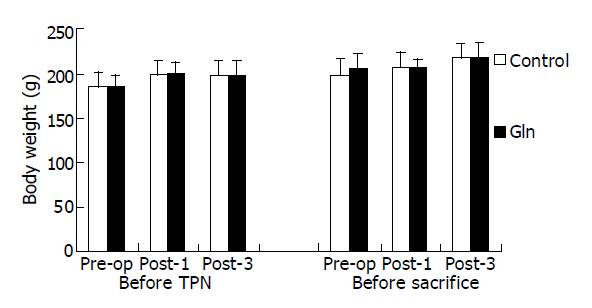
Figure 1 Body weights of experimental groups at the beginning of TPN administration and before sacrifice.
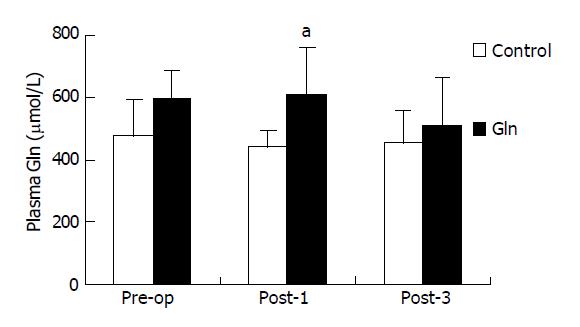
Figure 2 Plasma glutamine (Gln) levels of the 2 groups before and after surgery.
aP<0.05 vs control group on post-1d.
Figure 3 Nitrogen balance and cumulative nitrogen balance between the 2 groups after operation.
aP<0.05 vs control group on post-operative days. A: Nitrogen balance between the 2 groups after operation; B: Cumulative nitrogen balance between the 2 groups after operation.
Figure 4 Plasma growth hormone (GH) and insulin-like growth factor-I (IGF-I) concentrations between the 2 groups before and after operation.
aP<0.05 vs the corresponding group on post-operative days. A: Plasma growth hormone concentrations between the 2 groups before and after operation; B: Plasma insulin-like growth factor-1 concentrations between the 2 groups before and after operation.
Figure 5 Phagocytic activity of peritoneal macrophages and peripheral blood neutrophils.
A: Phagocytic activity of peritoneal macrophages measured by phagocytosis assay and read in the fluorescence plate reader using 480 nm for excitation and 520 nm for emission. aP<0.05 vs control group on post-1d; B: Peripheral blood neutrophils measured by flow cytometry; cP<0.05 vs the corresponding groups on post-operative days.
- Citation: Lee CH, Chiu WC, Chen SC, Wu CH, Yeh SL. Effects of glutamine-containing total parenteral nutrition on phagocytic activity and anabolic hormone response in rats undergoing gastrectomy. World J Gastroenterol 2005; 11(6): 817-822
- URL: https://www.wjgnet.com/1007-9327/full/v11/i6/817.htm
- DOI: https://dx.doi.org/10.3748/wjg.v11.i6.817


