Copyright
©2005 Baishideng Publishing Group Inc.
World J Gastroenterol. Feb 7, 2005; 11(5): 672-675
Published online Feb 7, 2005. doi: 10.3748/wjg.v11.i5.672
Published online Feb 7, 2005. doi: 10.3748/wjg.v11.i5.672
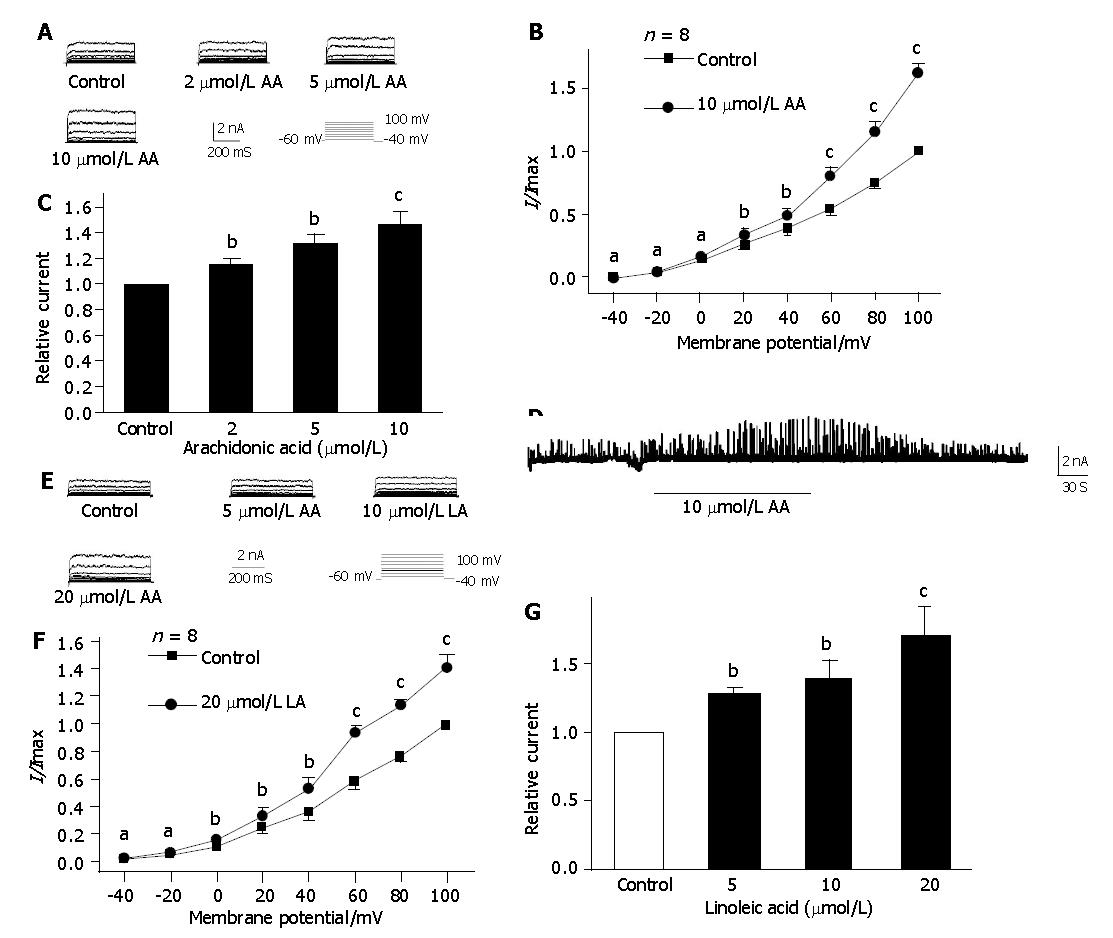
Figure 1 Effects of AA and LA on IK(Ca).
A: Raw traces of AA on IK(Ca) at different concentrations; B: I/V relationship of AA on IK(Ca). Peak values were normalized to the values obtained at 100mV under control condition (n = 8,aP>0.05, cP<0.05, bP<0.01 vs control);C: Dose-dependent increase of AA on IK(Ca) (n = 8, cP<0.05, bP<0.01 vs control); D: Increase of AA on STOCs; E: Raw traces of LA on IK(Ca) at different concentrations; F: I/V relationship of LA on IK(Ca) (n = 8, aP>0.05, cP<0.05, bP<0.01 vs control); G: Dose-dependent increase of LA on IK(Ca) (n = 8, aP<0.05, bP<0.01 vs control).
Figure 2 Comparison of different unsaturated fatty acids on IK(Ca).
A: Raw traces of 10 μmol/L OA, LA and AA on IK(Ca); B: Increased effect of different unsaturated fatty acids on IK(Ca) (n = 8, aP<0.05, bP<0.01 vs control).
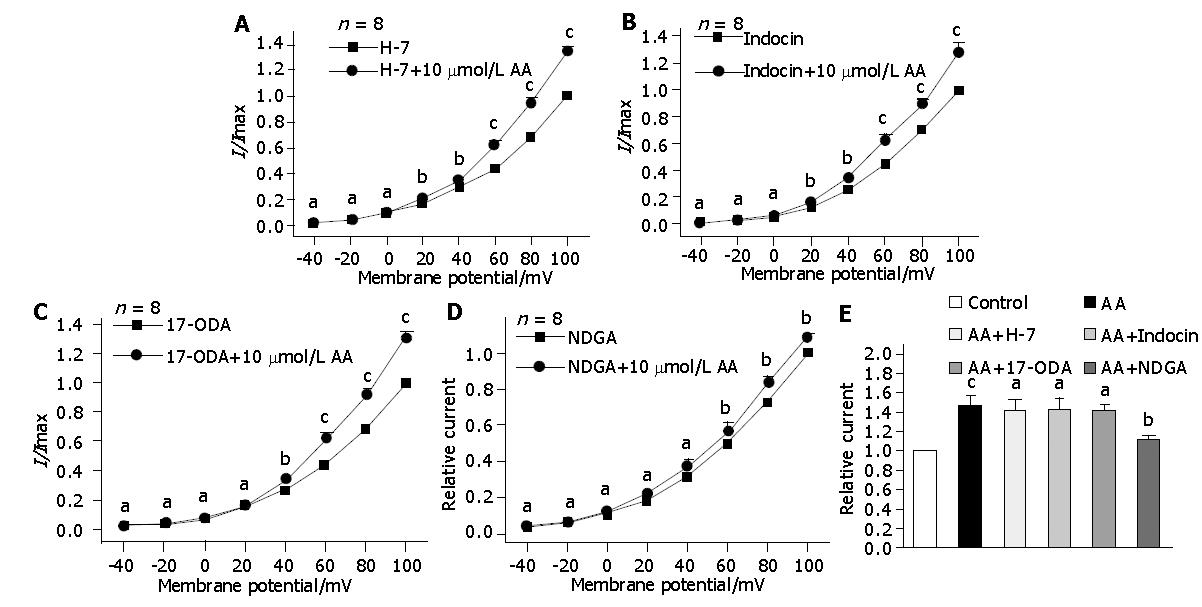
Figure 3 Effects of PKC inhibitor and oxygenase inhibitor on AA-induced increase of IK(Ca).
A, B, C and D: Effects of AA on IK(Ca) after pretreatment with H-7, indomethacin, 17-octadecynoic acid and nordihydroguaiaretic acid, respectively(n = 8, aP>0.05, cP<0.05, bP<0.01 vs control); E: Comparison of AA on IK(Ca) before and after pretreatment with H-7, indomethacin, 17-octadecynoic acid and nordihydroguaiaretic acid, respectively(n = 8, bP<0.01 vs control, aP>0.05 , cP<0.05 vs AA).
- Citation: Zheng HF, Li XL, Jin ZY, Sun JB, Li ZL, Xu WX. Effects of unsaturated fatty acids on calcium-activated potassium current in gastric myocytes of guinea pigs. World J Gastroenterol 2005; 11(5): 672-675
- URL: https://www.wjgnet.com/1007-9327/full/v11/i5/672.htm
- DOI: https://dx.doi.org/10.3748/wjg.v11.i5.672


