Copyright
©2005 Baishideng Publishing Group Inc.
World J Gastroenterol. Feb 7, 2005; 11(5): 656-660
Published online Feb 7, 2005. doi: 10.3748/wjg.v11.i5.656
Published online Feb 7, 2005. doi: 10.3748/wjg.v11.i5.656
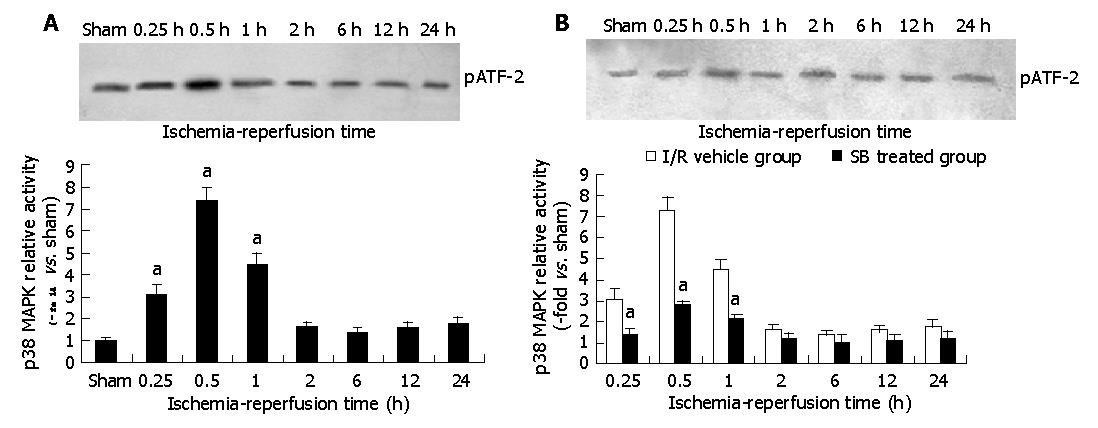
Figure 1 Changes of p38 mitogen-activated protein kinase activities in intestinal tissue after I/R (A) and of different groups after I/R (B).
aP<0.05 vs I/R vehicle group.
Figure 2 Apoptotic cell rate in intestinal tissue after I/R in I/R vehicle group (A) and apoptotic cells rate in intestinal tissue after I/R in I/R vehicle and SB 203580 treated groups (B).
aP<0.05 vs I/R vehicle group.
Figure 3 Plasma D-lactate level in intestinal tissue after I/R in I/R vehicle group (A) and plasma D-lactate level in intestinal tissue after I/R in I/R vehicle and SB 203580 treated groups (B).
aP<0.05 vs I/R vehicle group.
Figure 4 Villus structure.
A: Before I/R in sham-operation group; B: Structural changes of the villus after I/R in I/R vehicle group; C: Structural changes of the villus after I/R in SB 203580 treated group.
- Citation: Zheng SY, Fu XB, Xu JG, Zhao JY, Sun TZ, Chen W. Inhibition of p38 mitogen-activated protein kinase may decrease intestinal epithelial cell apoptosis and improve intestinal epithelial barrier function after ischemia- reperfusion injury. World J Gastroenterol 2005; 11(5): 656-660
- URL: https://www.wjgnet.com/1007-9327/full/v11/i5/656.htm
- DOI: https://dx.doi.org/10.3748/wjg.v11.i5.656


