Copyright
©2005 Baishideng Publishing Group Inc.
World J Gastroenterol. Feb 7, 2005; 11(5): 649-655
Published online Feb 7, 2005. doi: 10.3748/wjg.v11.i5.649
Published online Feb 7, 2005. doi: 10.3748/wjg.v11.i5.649
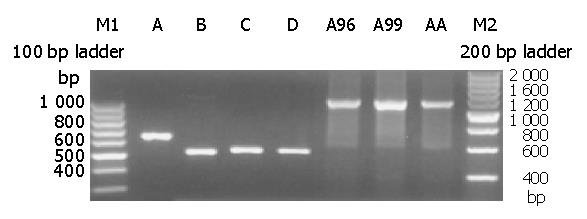
Figure 1 Electrophoresis of mutagenesis PCR product.
Lanes A-D: Different HBV fragments using different mutated primers, Lanes E-G: The second round PCR products.
Figure 2 Local sequences of mutagenesis sites of 4 recombinants.
Arrowhead indicates the mutated nucleosides. A: pUC18-HBV1.2-WT; B: pUC18-HBV1.2-A1896; C: pUC18-HBV1.2-A1899; D: pUC18-HBV1.2-AA.
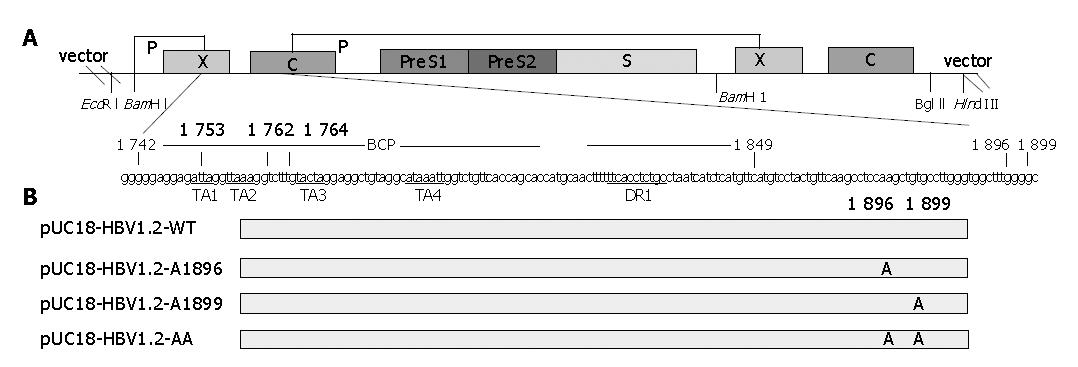
Figure 3 Sketch map of structure of plasmid pUC-HBV1.
2 and the mutation sites of all constructed plasmids. Panel A: Upper line and box figure indicate the 1.2 copy HBV genome cloned into pUC18 EcoRI and Hind III sites. Different open reading frames are indicated with corresponding box. Lower letters indicate HBV BCP and precore region sequence, TA rich region and DR region are underlined. Scheduled nucleosides to be mutated are indicated with numeral; Panel B: Recombinant constructs and their corresponding mutation sites. The constructs are listed at left, long gray box indicate consensus sequences, mutation nucleosides and their sites are indicated.
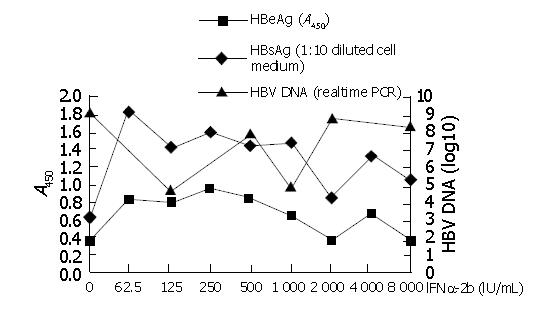
Figure 4 Detection of HBsAg, HBeAg, HBV DNA secreted to the cell medium with different concentrations of interferon.
-
Citation: Wang Y, Wei L, Jiang D, Cong X, Fei R, Xiao J, Wang Y.
In vitro resistance to interferon of hepatitis B virus with precore mutation. World J Gastroenterol 2005; 11(5): 649-655 - URL: https://www.wjgnet.com/1007-9327/full/v11/i5/649.htm
- DOI: https://dx.doi.org/10.3748/wjg.v11.i5.649


