Copyright
©2005 Baishideng Publishing Group Inc.
World J Gastroenterol. Nov 28, 2005; 11(44): 6910-6919
Published online Nov 28, 2005. doi: 10.3748/wjg.v11.i44.6910
Published online Nov 28, 2005. doi: 10.3748/wjg.v11.i44.6910
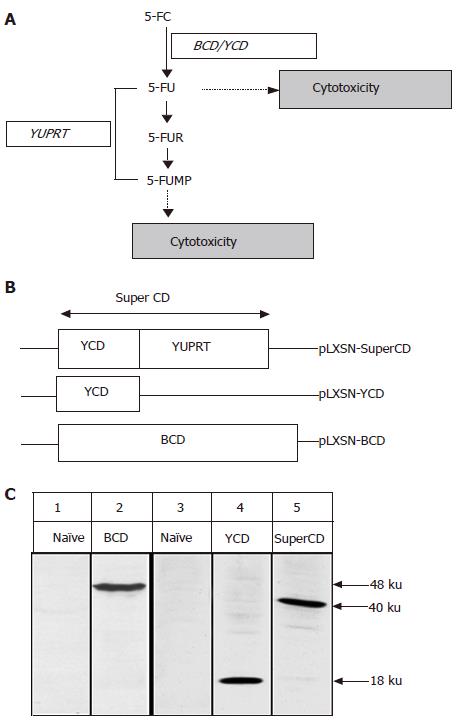
Figure 1 Mode of action of SuperCD (YCD::YUPRT) fusion.
Panel A: Schematic representation of biological pathways resulting in cytotoxicity following cytosine deaminase/uracil phosphoribosyltransferase (UPRT)-mediated toxification of the prodrug 5-FC. 5-FC: 5-fluorocytosine; 5-FU: 5-fluorouracil; 5-FUR: 5-fluorouridine; 5-FUMP: 5-fluorouridine 5'-monophosphate; CD: cytosine deaminase; YUPRT: yeast uracil phosphoribosyltransferase. Panel B: Schematic representation of retroviral vectors used, in which suicide gene expression was placed under the retroviral 5' LTR. Panel C: Western blot detection of suicide gene expression in retrovirally generated stable SuperCD/YCD/BCD-expressing Morris hepatoma (MH) cell lines employing polyclonal rabbit antisera directed against BCD (lanes 1 and 2) and YCD (for detection of both SuperCD and YCD; lanes 3-5). Lane 1: MH naïve cells (negative control); lane 2: MH BCD cells, exhibiting a 48-ku band specific for BCD; lane 3: MH naïve cells (negative control); lane 4: MH YCD cells, exhibiting a 18-ku band specific for YCD; lane 5: MH SuperCD cells, exhibiting a 40-ku band specific for the YCD::YUPRT fusion, i.e. SuperCD. Numbers on the right hand side indicate the sizes of the expected proteins.
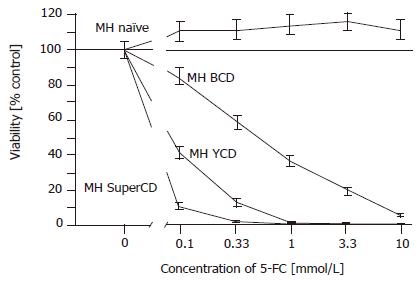
Figure 2 SRB cytotoxicity assay with stable BCD, YCD, SuperCD expressing Morris hepatoma (MH) cell lines generated by retroviral transduction.
Untransduced MH3924A cells (MH naïve) and stably transduced Morris hepatoma cell lines (MH BCD, MH YCD, MH SuperCD) were seeded on 24-well plates. After 4 d of 5-FC treatment, the growth inhibition was determined by SRB staining and measured at 550 nm. All values were referred to that of the untransduced control cells without the addition of 5-FC and are given as percentage of surviving cells (control: 100%). All experiments were carried out at least in quadruplicate. Viability values plotted represent fitted medians and 95%CI.
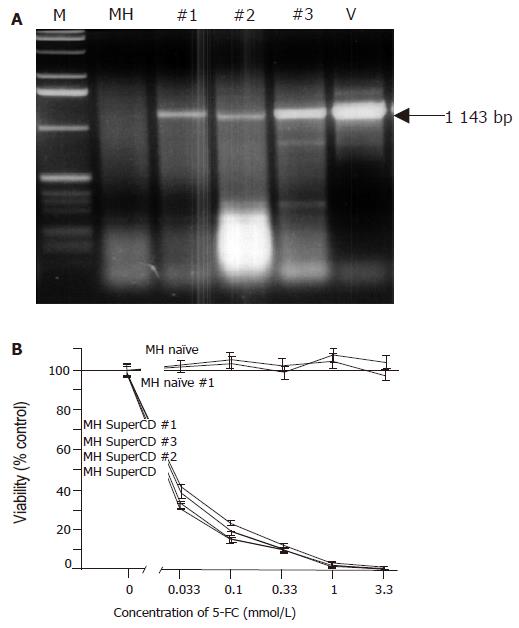
Figure 3 Molecular and functional analysis of subcutaneously grown control tumors explanted on d 18 (saline-treated MH SuperCD/MH naïve tumors).
A: Agarose gel electrophoresis of SuperCD DNA-specific PCR products. Lane M: marker DNA ladder; lane MH: MH parental cell line (no transgene; negative control; PCR performed with 1 μg of DNA); lanes 1-3: PCR amplifications performed on MH SuperCD tumor tissues of animals 1, 2, 3 (PCR performed with 1–3 µg of DNA); lane V: vector control lane (PCR performed with 1 pg of pLXSN-SuperCD). Arrow: indicates 1 143-bp SuperCD-specific amplification product. B: SRB cytotoxicity assay with recultured tumor cells explanted after 18 d of subcutaneous growth. As in Figure 2, cytotoxicity was measured after 5-FC treatment for 4 d in vitro. MH naïve: negative control with MH parental cell line (no transgene; no animal passage); MH naïve, #1: MH naïve tumor explanted from a saline-treated animal (control); MH SuperCD, cell line: MH SuperCD parental cell line (control; no animal passage); MH SuperCD 1, 2, 3, tumor passage: MH SuperCD tumors explanted from saline-treated animals 1, 2, 3. All values were referred to that of the untransduced control cells and are given as percentage of surviving cells (control: 100%). All experiments were carried out in quadruplicate. Viability values plotted represent fitted medians and 95%CI.
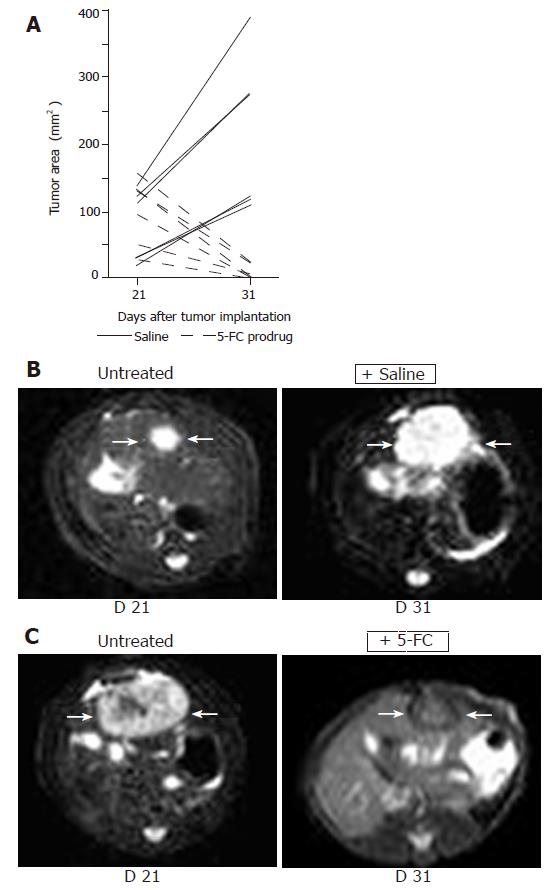
Figure 4 Non-invasive MRI detection of tumor growth of orthotopically implanted MH SuperCD hepatomas (saline vs 5-FC prodrug treatment).
Animals with MRI detectable liver tumors in T2 weighed images were randomized into two groups (6 rats/group) and treated twice daily with ip injections of saline or 5-FC (283 mg/kg body weight) over a 10-d period. Panel A: Maximum tumor areas (mm2) at d 21 and d 31; solid lines: tumor growth of control animals (saline-treated); broken lines: tumor regression of serum animals (5-FC-treated). Panel B: Representative MRI tumor images of the saline-treated control animal exhibiting the smallest tumor area at d 21 (left); and a dramatic tumor growth was observed at d 31 (right). Panel C: Representative MRI tumor images of the serum animal (treated with 5-FC) exhibiting the largest tumor area at d 21 (left); and a dramatic tumor regression was measured at d 31 (right).
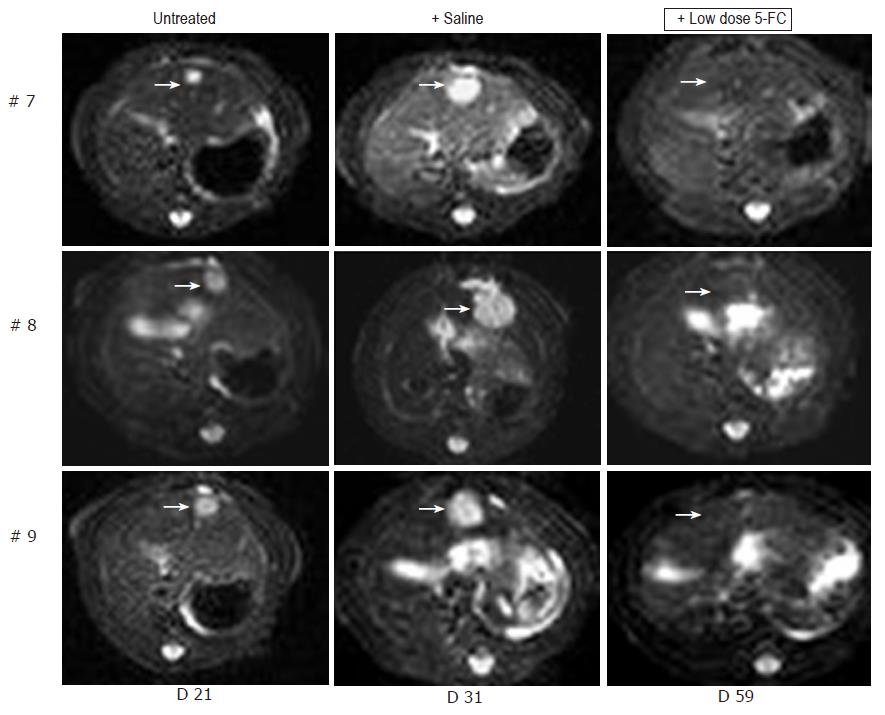
Figure 5 MRI detection of tumor growth of orthotopically implanted MH SuperCD hepatomas treated under a low-dose 5-FC regimen.
Animals #7, #8, #9 (column 1: tumor size at d 21), which first had been treated with saline only for over a 7-d period and thereafter, uniformly exhibiting a substantial tumor growth (column 2: tumor size at d 31), were then treated by a low-dose 5-FC regimen [twice weekly ip injections of 5-FC (283 mg/kg body weight)] over a 28-d period until d 59. Analysis of subsequent MRI sections did not reveal any MH SuperCD tumors (column 3, d 59: +low dose 5-FC); T2 weighed images are depicted; arrows in column 3 point out to places of former tumor localizations before the onset of 5-FC treatment.
Figure 6 Direct in vivo comparison of SuperCD vs YCD vs BCD suicide gene effectiveness.
Approximately 1×10⁷ cells of the four cell-lines MH naїve, MH BCD, MH YCD, and MH SuperCD were injected subcutaneously into male ACI rats. After 15 d, prodrug application started with twice weekly ip injections of 283 mg of 5-FC/kg body weight as indicated by black diamonds in panel B. Panel A: Depiction of tumor volumes of all four cell lines in all animals at four time points after implantation. Panel B: Median tumor volume regression lines by analysis of covariance of log tumor volumes. As a result, significant reductions in median tumor volumes under low dose 5-FC application were observed only for the MH SuperCD tumors.
- Citation: Graepler F, Lemken ML, Wybranietz WA, Schmidt U, Smirnow I, Groß CD, Spiegel M, Schenk A, Graf H, Lauer UA, Vonthein R, Gregor M, Armeanu S, Bitzer M, Lauer UM. Bifunctional chimeric SuperCD suicide gene -YCD: YUPRT fusion is highly effective in a rat hepatoma model. World J Gastroenterol 2005; 11(44): 6910-6919
- URL: https://www.wjgnet.com/1007-9327/full/v11/i44/6910.htm
- DOI: https://dx.doi.org/10.3748/wjg.v11.i44.6910


