Copyright
©2005 Baishideng Publishing Group Inc.
World J Gastroenterol. Nov 28, 2005; 11(44): 6905-6909
Published online Nov 28, 2005. doi: 10.3748/wjg.v11.i44.6905
Published online Nov 28, 2005. doi: 10.3748/wjg.v11.i44.6905
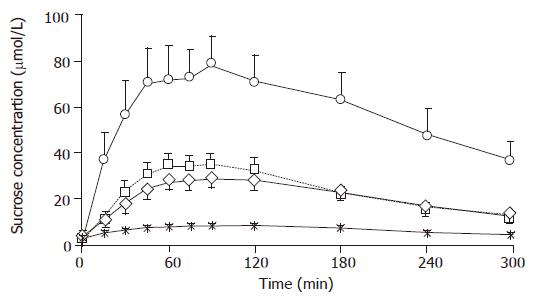
Figure 1 Changes in serum sucrose level in HV, GU, EGC, and AGC groups (mean±SE).
The serum sucrose level in EGC group (□) showed a significant difference between 30 and 300 min after the sucrose loading as compared to the HV group () between 30 and 240 min (P<0.01) and 30 and 300 min (P<0.05). The serum sucrose level of AGC (○) patients showed a significant difference from HV () between 15 and 300 min after sucrose loading, GU (◇) and EGC (□) (P<0.01). GU patients (◇) showed a significant difference from the HV group ( ) between 45 and 240 min after sucrose loading (45 min, P<0.05; from 60 to 240 min, P<0.01). However, there was no significant difference in serum sucrose level in HV group from 15 to 300 min after loading as compared with either EGC (◇) or GU (□) group.
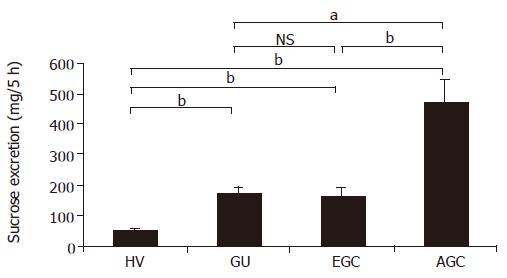
Figure 2 Amounts of sucrose excreted into urine in HV, GU, EGC and AGC groups (mean±SE).
Even in the urine collection method, the amount of sucrose excreted in GU, EGC and AGC groups showed a significant difference (bP<0.01) as compared with the HV group, and AGC group showed a significant difference (bP<0.01) from both GU and EGC groups. However, no significant difference was seen in either EGC; NS: no significant difference.
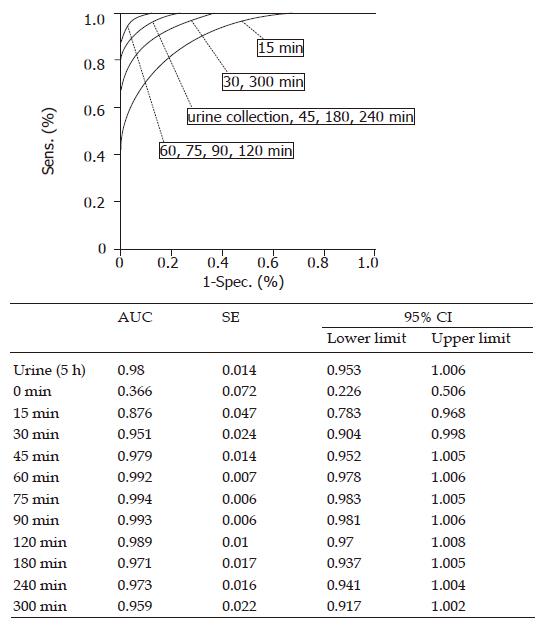
Figure 3 Receiver operator characteristics (ROC) curve and AUC of ROC curve.
Comparison of the ROC curve of the sucrose test and AUC at each time point. There was no significant difference between the urine collection method and the serum method from 30 to 300 min. AUC: Area under the ROC curve; SE: standard error; CI: confidence interval.
Figure 4 Relationship between serum sucrose level at 60 min and surface area of gastric cancer.
The serum sucrose level at 60 min was closely correlated with the surface area of the gastric cancer (r = 0.83, P<0.01).
- Citation: Shishido T, Yamaguchi T, Odaka T, Seimiya M, Saisho H, Nomura F. Significance of a novel sucrose permeability test using serum in the diagnosis of early gastric cancer. World J Gastroenterol 2005; 11(44): 6905-6909
- URL: https://www.wjgnet.com/1007-9327/full/v11/i44/6905.htm
- DOI: https://dx.doi.org/10.3748/wjg.v11.i44.6905


