Copyright
©2005 Baishideng Publishing Group Inc.
World J Gastroenterol. Nov 21, 2005; 11(43): 6792-6799
Published online Nov 21, 2005. doi: 10.3748/wjg.v11.i43.6792
Published online Nov 21, 2005. doi: 10.3748/wjg.v11.i43.6792
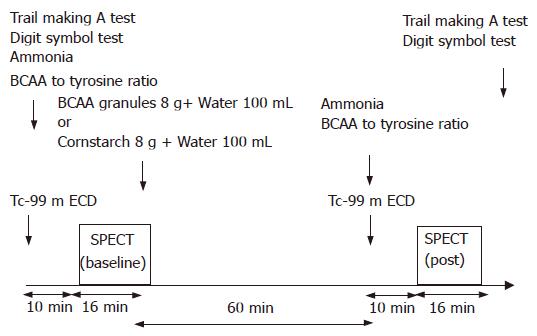
Figure 1 Study protocol.
Baseline SPECT imaging was taken 10 min after the injection of 278 MBq ECD. After baseline SPECT, BCAA granules or placebo were orally administered. Sixty minutes later, another 278 MBq of technetium-99 m ECD was intravenously administered and a second SPECT acquisition was performed 10 min after the injection of ECD. Laboratory and neuropsychological tests were taken before and after the administration of BCAA or placebo. SPECT, single photon emission computed tomography; ECD, ethyl cysteinate dimer; BCAA, branched-chain amino acid
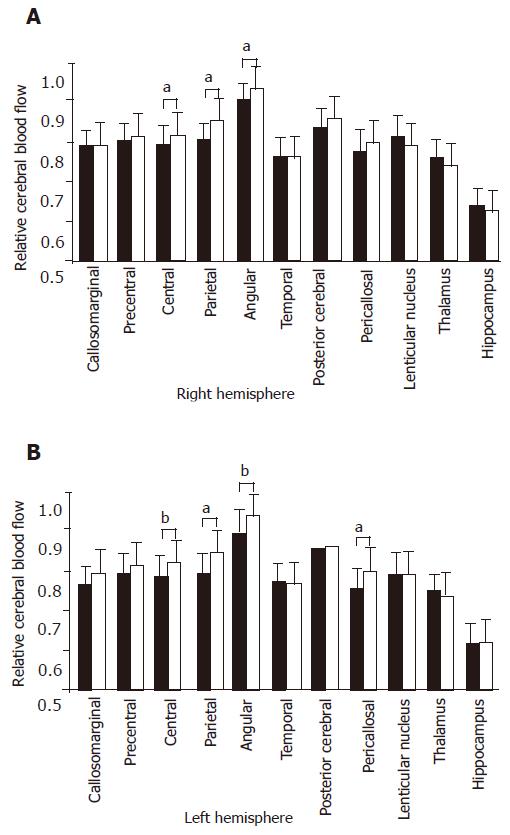
Figure 2 Relative CBF of different brain regions.
Comparison of patients with liver cirrhosis (closed bars) and healthy subjects (open bars). Data were expressed as the mean±SD. aP<0.05, bP<0.01, dP<0.001. CBF, cerebral blood flow.
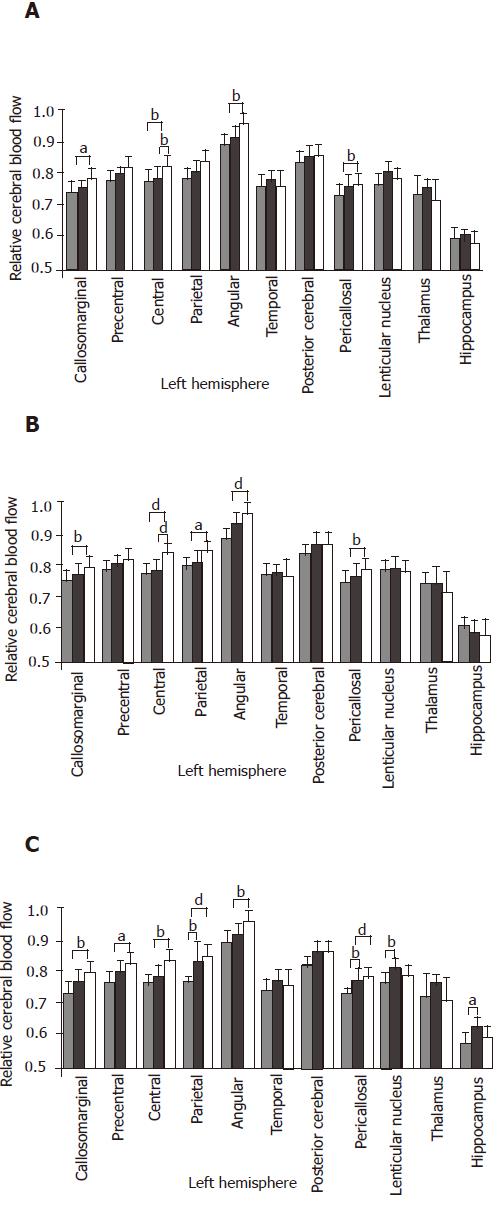
Figure 3 Relative CBF of different brain regions.
A: Comparison of cirrhotic patients with hyperammonemia (gray bars), normal ammonemia (dashed bars) and healthy subjects (open bars); B: Comparison of cirrhotic patients with severe decrease in the levels of serum BCAA to tyrosine ratio (gray bars), with mild decrease in serum BCAA to tyrosine ratio (dashed bars) and healthy subjects (open bars); C: Comparison of patients with minimal encephalopathy (gray bars), with grade-0 encephalopathy (dashed bars) and healthy subjects (open bars).
Figure 4 Changes in relative CBF of different brain regions.
CBF was compared before and after BCAA. A: Left precentral; B: left parietal; C: left angular; D: left temporal; E: left pericallosal; F: left thalamus. Data were expressed as the mean±SD and range. aP<0.05V vs CBF, cerebral blood flow; BCAA, branched-chain amino acid.
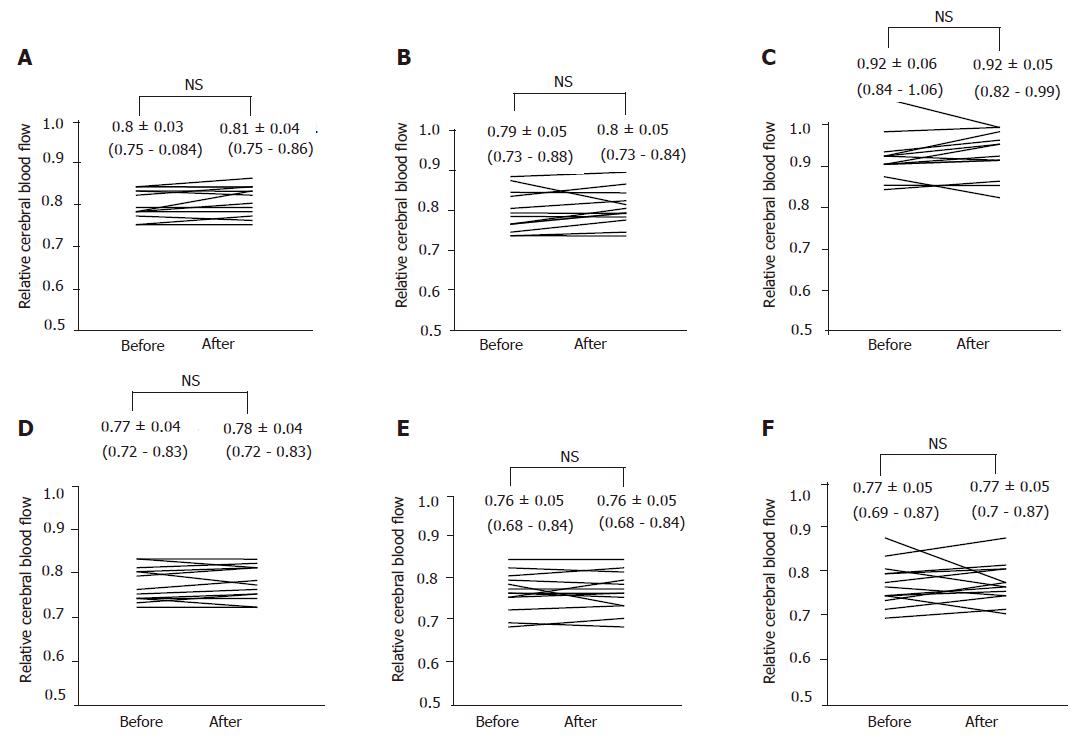
Figure 5 Changes in relative CBF of different brain regions.
CBF was compared before and after placebo. A: Left precentral; B: left parietal; C: left angular; D: left temporal; E: left pericallosal; F: left thalamus. Data were expressed as the mean±SD and range. CBF, cerebral blood flow.
- Citation: Yamamoto M, Iwasa M, Matsumura K, Nakagawa Y, Fujita N, Kobayashi Y, Kaito M, Takeda K, Adachi Y. Improvement of regional cerebral blood flow after oral intake of branched-chain amino acids in patients with cirrhosis. World J Gastroenterol 2005; 11(43): 6792-6799
- URL: https://www.wjgnet.com/1007-9327/full/v11/i43/6792.htm
- DOI: https://dx.doi.org/10.3748/wjg.v11.i43.6792


