Copyright
©2005 Baishideng Publishing Group Inc.
World J Gastroenterol. Nov 21, 2005; 11(43): 6792-6799
Published online Nov 21, 2005. doi: 10.3748/wjg.v11.i43.6792
Published online Nov 21, 2005. doi: 10.3748/wjg.v11.i43.6792
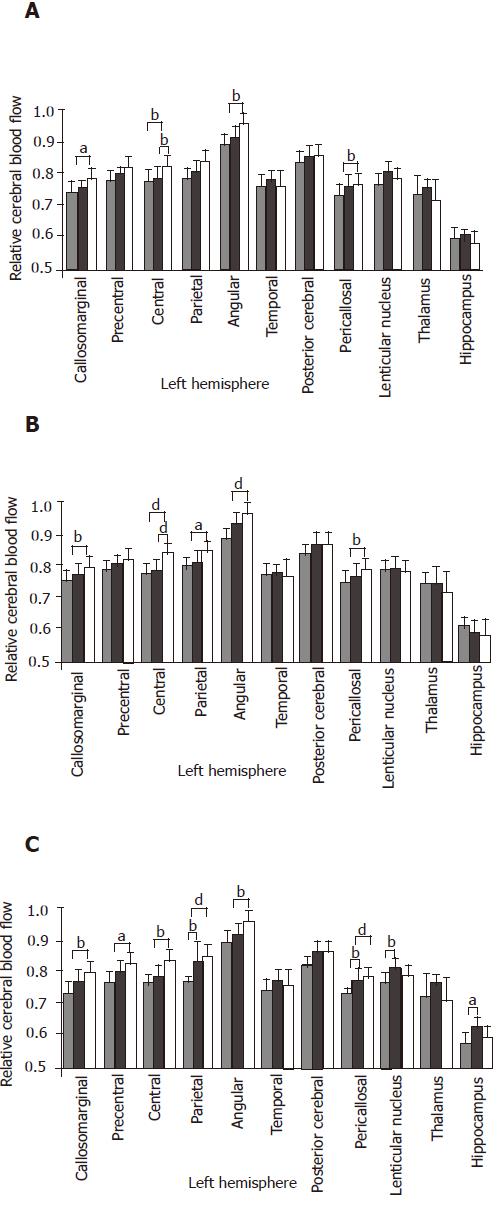
Figure 3 Relative CBF of different brain regions.
A: Comparison of cirrhotic patients with hyperammonemia (gray bars), normal ammonemia (dashed bars) and healthy subjects (open bars); B: Comparison of cirrhotic patients with severe decrease in the levels of serum BCAA to tyrosine ratio (gray bars), with mild decrease in serum BCAA to tyrosine ratio (dashed bars) and healthy subjects (open bars); C: Comparison of patients with minimal encephalopathy (gray bars), with grade-0 encephalopathy (dashed bars) and healthy subjects (open bars).
- Citation: Yamamoto M, Iwasa M, Matsumura K, Nakagawa Y, Fujita N, Kobayashi Y, Kaito M, Takeda K, Adachi Y. Improvement of regional cerebral blood flow after oral intake of branched-chain amino acids in patients with cirrhosis. World J Gastroenterol 2005; 11(43): 6792-6799
- URL: https://www.wjgnet.com/1007-9327/full/v11/i43/6792.htm
- DOI: https://dx.doi.org/10.3748/wjg.v11.i43.6792


