Copyright
©2005 Baishideng Publishing Group Inc.
World J Gastroenterol. Oct 28, 2005; 11(40): 6312-6321
Published online Oct 28, 2005. doi: 10.3748/wjg.v11.i40.6312
Published online Oct 28, 2005. doi: 10.3748/wjg.v11.i40.6312
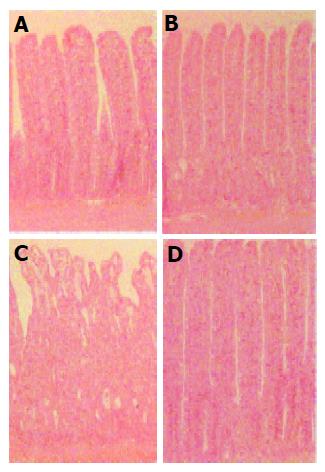
Figure 1 Histopathological study in ilea after X-irradiation with a single dose of 10 Gy.
Ileal structure before (A) and one (B), three (C) and seven (D) days after abdominal X-irradiation. Magnification x100.
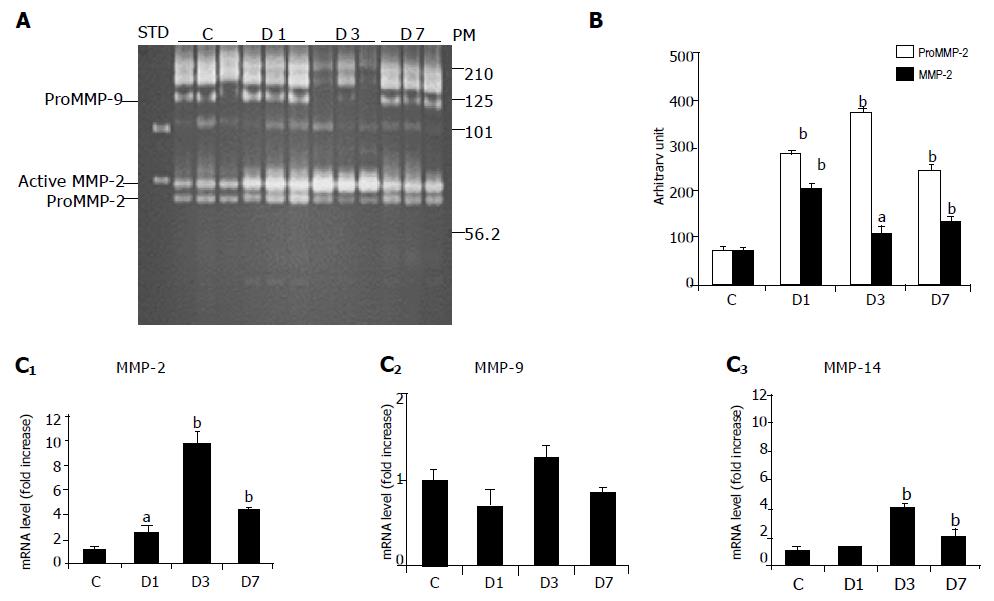
Figure 2 Gelatinases activities in ilea after X-irradiation with a single dose of 10 Gy.
A: Study of gelatinases activities by zymography. Lane STD shows MMP-2 and MMP-9 standards, lane 2-4, 5-7; 8-10; 11-13 shows gelatinase activities in ilea from control rats (C) and one (D1), three (D3) and seven (D7) days after X-irradiation respectively; B: Densitometric analysis of zymography. Results are mean±SE, significantly different from controls: aP<0.05, bP<0.01 vs others. C1-3: Analysis of MMP-2, MMP-9 and MMP-14 gene expression. mRNA levels were measured by real time RT-PCR in control ilea from control rats (C) or one (D1), three (D3) and seven (D7) days after X-irradiation respectively. Results are mean±SE, significantly different from controls: aP<0.05, bP<0.01 vs others.
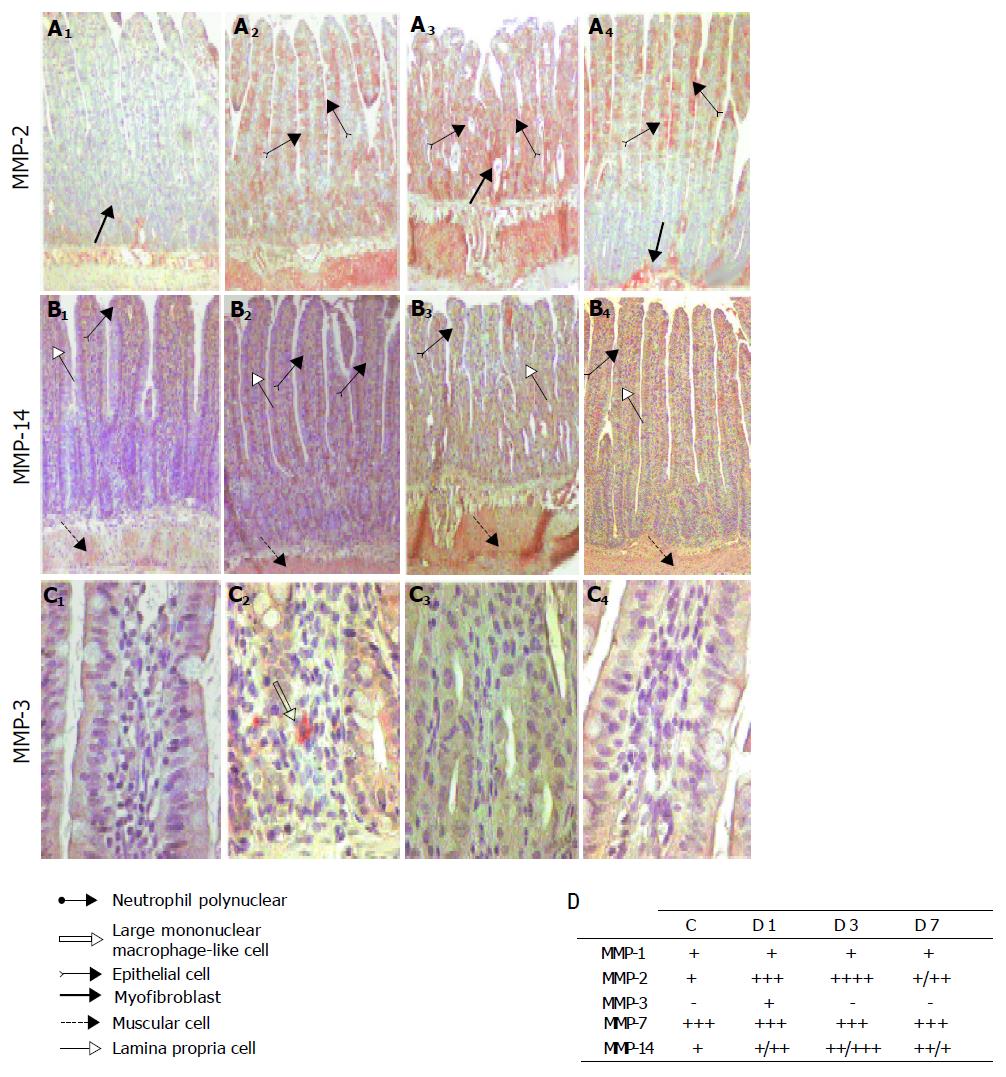
Figure 3 Tissue localization of gelatinase A and other MMPs in ilea after X-irradiation with a single dose of 10 Gy.
A2: MMP-2, MMP-14 and MMP-3 immunostaining. In control ilea, MMP-2 staining was observed in the pericryptal myofibroblast sheath, inflammatory cells and smooth muscle cells (A1, x100). On day one and three (A2; A3, x100), increased MMP-2 staining was found in all of the layer of the bowel particularly in smooth muscle cells and in epithelial cells. On day seven (A4, x100) MMP-2 staining was weaker and found in smooth muscle cells, epithelial cells of the villus only and pericryptal myofibroblast sheath. In control ilea, MMP-14 staining was observed in the inflammatory cells of the lamina propria, smooth muscle cells and some epithelial cells of the top of the villi (B1, x100). No significant modification in MMP-14 staining was found in irradiated ilea on day one (B2; x100), whereas on day three MMP-14 staining spread to the whole tissue (B3, x100). On day seven (B4, x100), MMP-14 staining return to control level except in the epithelial cells of the top of the villus. In control ilea, no MMP-3 staining was observed (C1, x400), but a staining was observed in mononuclear infiltrated cells day one after X-irradiation (C2, x400); D: MMPs immunostaining scoring. (-) represent no staining, (+) weak staining, (++) moderate staining, (+++) important and (++++) strong staining.
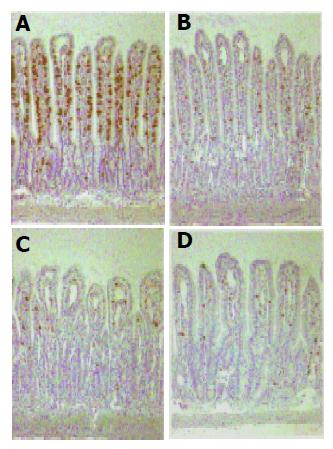
Figure 4 CD8a positive T cells after X-irradiation with a single dose of 10 Gy.
Immunostaining for CD8a positive cells in control ilea (A) and one (B), three (C) and seven (D) days after X-irradiation. Magnification x100.
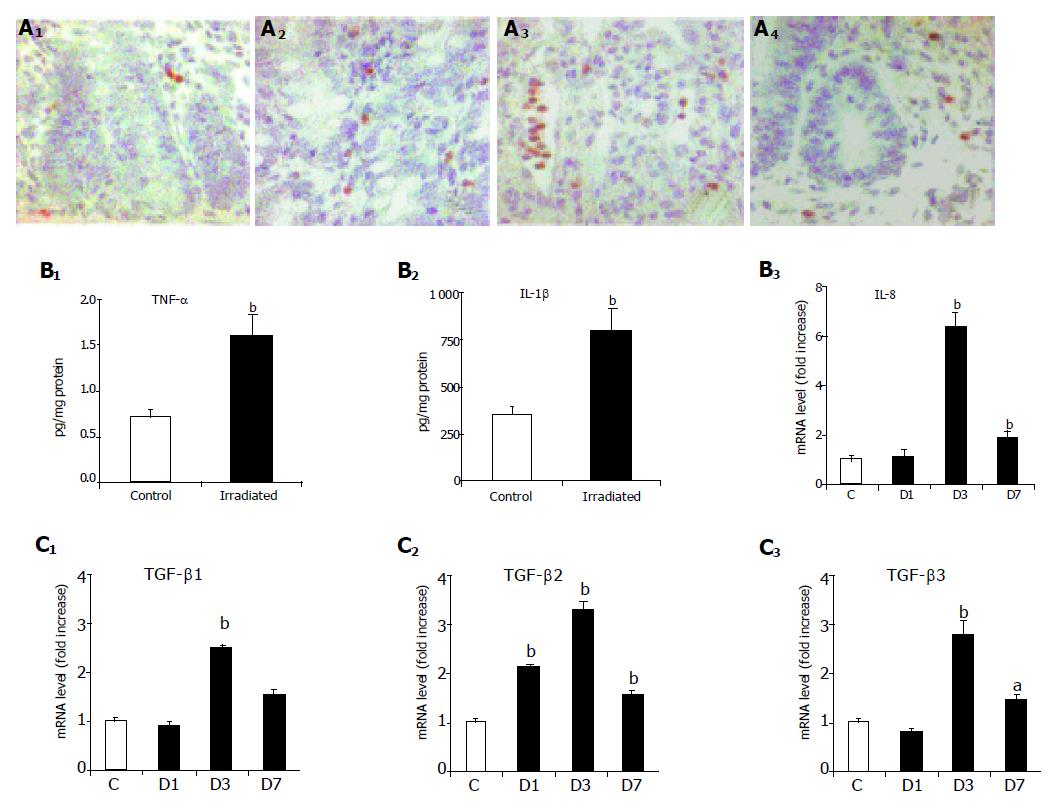
Figure 5 Radiation-induced inflammation.
A: Myeloperoxidase positive cells in X-irradiated ilea. Immunostaining for myeloperoxidase positive cells in control ilea (A1) and one (A2), three (A3) and seven (A4) days after X-irradiation respectively. Magnification x 400; B1-3: Concentration of TNF-α and IL-1β six hours, and IL-8 mRNA level one to seven days, after X-irradiation with a single dose of 10 Gy. Results are mean±SE, significantly different from controls: aP<0.05, bP<0.01 vs others; C1-3: TGF-β1, β2 and β3 mRNA level after X-irradiation with a single dose of 10 Gy. Gene expression of TGF-β1, TGF-β2 and TGF-β3, was determined by real-time RT-PCR in control ilea (C) one (D1), three (D3) and seven (D7) days after X-irradiation respectively. Results are mean±SE, significantly different from controls: aP<0.05, bP<0.01 vs others.
Figure 6 Plasminogen, U-PA, t-PA and PAI-1 mRNA level after X-irradiation with a single dose of 10 Gy.
Gene expressions of plasminogen, U-PA, t-PA and PAI-1 were determined by real-time RT-PCR measured in control ilea (C) and one (D1), three (D3) and seven days (D7) after X-irradiation. Results are mean±SE, significantly different from controls: aP<0.05, bP<0.01 vs others (A-D).
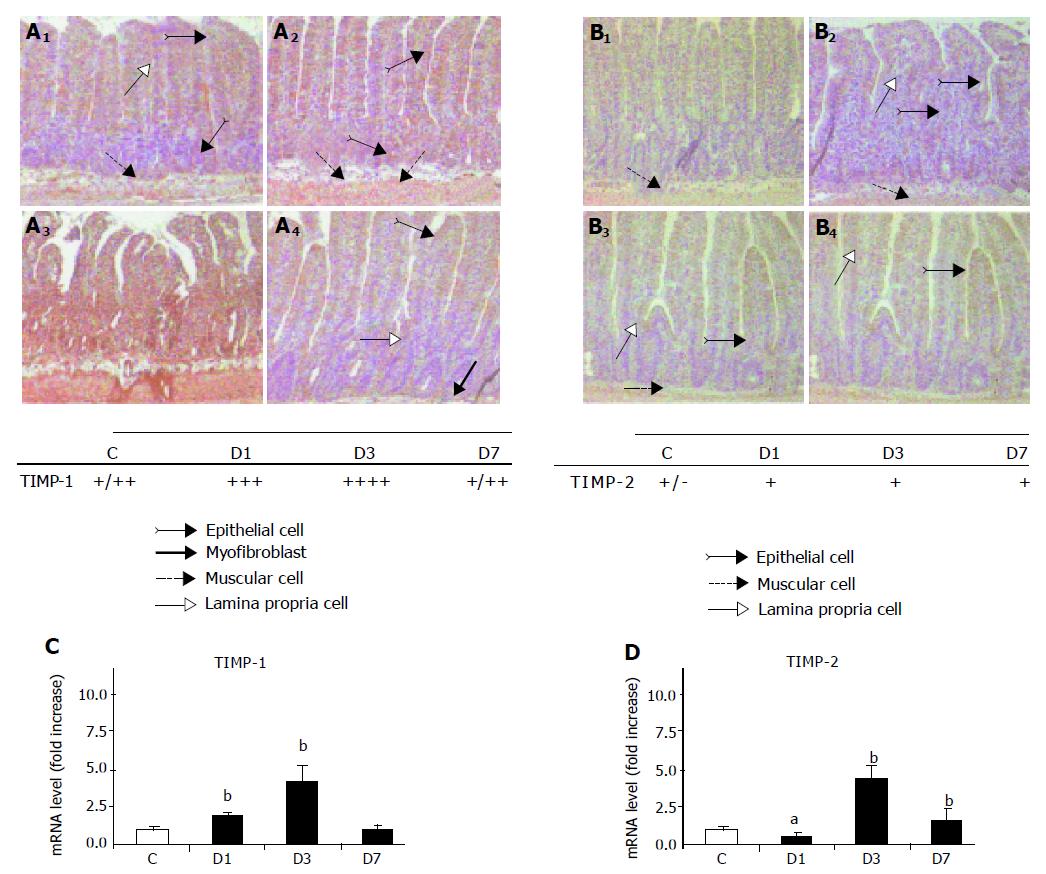
Figure 7 TIMP expression after X-irradiation with a single dose of 10 Gy.
A: In control ilea, TIMP-1 staining was observed in the inflammatory cells of the lamina propria, smooth muscle cells and some rare epithelial cells of the crypt and of the top of the villus (A1, x100). On day one (A2, x100), TIMP-1 staining was found in all layers of the bowel and particularly in epithelial cells and in smooth muscle cells . On day three (A3, x100), the staining spread to the whole tissue. On day seven (A4, x100), TIMP-1 staining was found in smooth muscle cells, epithelial cells of the villus only , in pericryptal myofibroblast sheath and in inflammatory cells of the lamina propria. Gene expression of TIMP-1, determined by real-time RT-PCR was measured in control ilea (C) one (D1), three (D3) and seven (D7) days after X-irradiation respectively. Results are mean±SE, significantly different from controls: aP<0.05, bP<0.01. B: In control ilea, weak TIMP-2 staining was observed in smooth muscle cells (B1, x100). On day one (B2, x100) and day three (B3, x100) after X-irradiation, a slight TIMP-2 increase was found in smooth muscle cells, in epithelial cells and in inflammatory cells of the lamina propria. On day seven (B4, x100),(C,D) TIMP-2 staining was observed in epithelial cells on the top of the villus, inflammatory cells of the lamina propria. Gene expression of TIMP-2, determined by real-time RT-PCR was measured in control ilea (C) one (D1), three (D3) and seven (D7) days after X-irradiation respectively. Results are mean±SE, significantly different from controls: aP<0.05, bP<0.01 vs others.
- Citation: Strup-Perrot C, Vozenin-Brotons MC, Vandamme M, Linard C, Mathé D. Expression of matrix metalloproteinases and tissue inhibitor metalloproteinases increases in X-irradiated rat ileum despite the disappearance of CD8a T cells. World J Gastroenterol 2005; 11(40): 6312-6321
- URL: https://www.wjgnet.com/1007-9327/full/v11/i40/6312.htm
- DOI: https://dx.doi.org/10.3748/wjg.v11.i40.6312


