Copyright
©2005 Baishideng Publishing Group Inc.
World J Gastroenterol. Oct 28, 2005; 11(40): 6288-6294
Published online Oct 28, 2005. doi: 10.3748/wjg.v11.i40.6288
Published online Oct 28, 2005. doi: 10.3748/wjg.v11.i40.6288
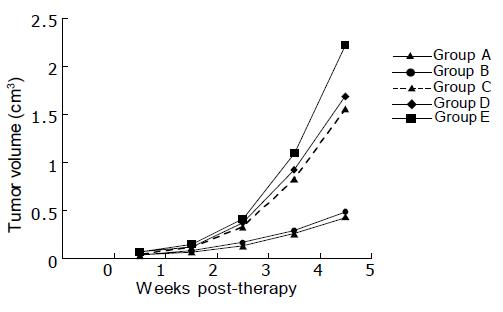
Figure 1 Transplant tumor growth curves.
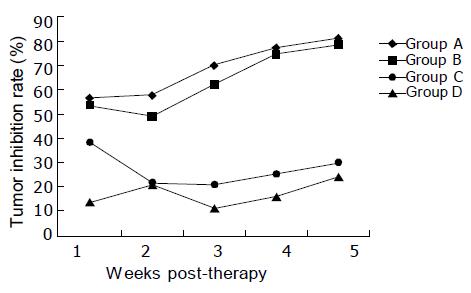
Figure 2 Curves of growth inhibition rate of transplant tumors.
Figure 3 HE staining of tumor tissues in nude mice bearing human colon carcinoma after receiving three-step pretargeting RIT (A), 153Sm-CEA McAb RIT (B) and normal saline (C).
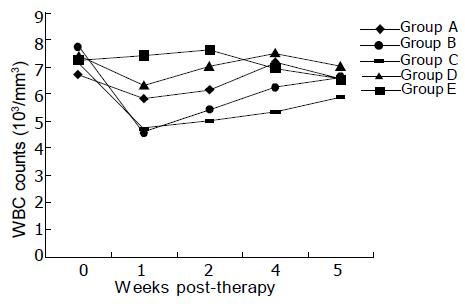
Figure 4 WBC counts after injection of drugs.
- Citation: Li GP, Zhang H, Zhu CM, Zhang J, Jiang XF. Avidin-biotin system pretargeting radioimmunoimaging and radioimmunotherapy and its application in mouse model of human colon carcinoma. World J Gastroenterol 2005; 11(40): 6288-6294
- URL: https://www.wjgnet.com/1007-9327/full/v11/i40/6288.htm
- DOI: https://dx.doi.org/10.3748/wjg.v11.i40.6288


