Copyright
©2005 Baishideng Publishing Group Inc.
World J Gastroenterol. Oct 28, 2005; 11(40): 6281-6287
Published online Oct 28, 2005. doi: 10.3748/wjg.v11.i40.6281
Published online Oct 28, 2005. doi: 10.3748/wjg.v11.i40.6281
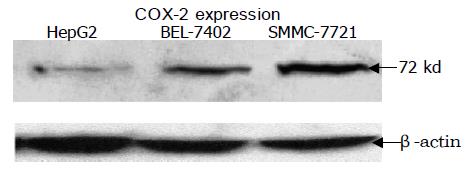
Figure 1 Expression of COX-2 in HepG2, BEL-7402 and SMMC-7721 HCC cell lines shown by Western blotting.
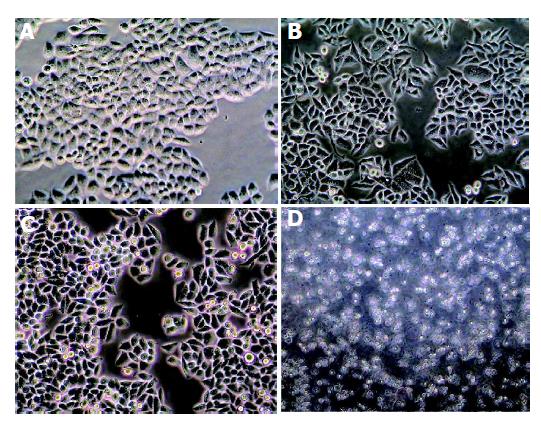
Figure 2 Growth inhibitory effect of celecoxib on SMMC-7721 cell lines.
A: Normal control; B: 25.00 mmol/L celecoxib for 6 h; C: 25.00 mmol/L celecoxib for 24 h; D: 50.00 mmol/L celecoxib for 48 h. (Original magnification, ×200).
Figure 3 Growth inhibitory effects of celecoxib on HepG2 (A), SMMC-7721 (B) and BEL-7402 (C) HCC cells.
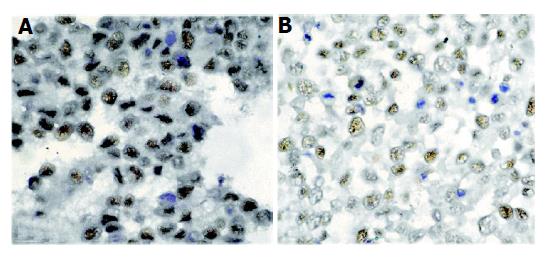
Figure 4 Immunocytochemical staining of PCNA in HepG2 cells in the presence or absence of celecoxib.
A: normal control; B: 25.00 mmol/L celecoxib for 24 h.
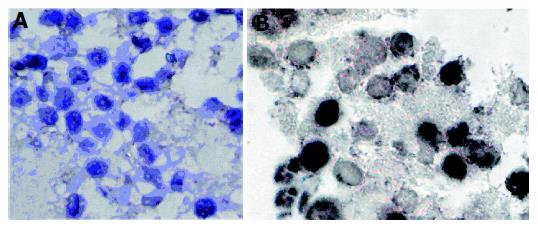
Figure 5 Cell apoptosis induced by celecoxib.
A: Normal control; B: Apoptosis of BEL-7402 cell assessed by TUNEL.
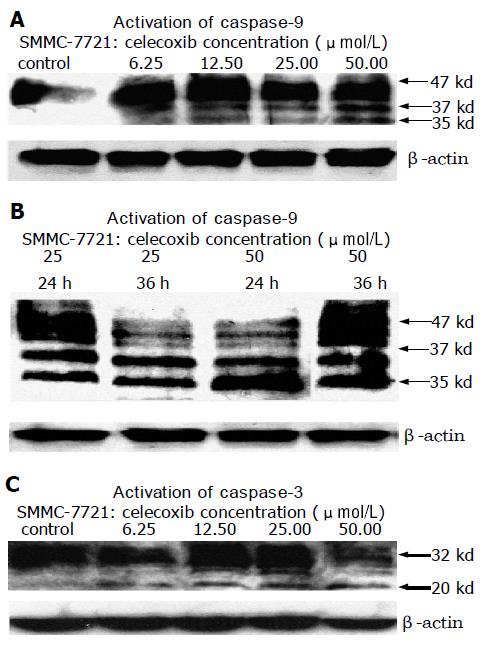
Figure 6 Activation of caspase-9 and caspase-3 after treatment with celecoxib.
A: Activation of caspase-9 after being treated with celecoxib for 12 h; B: Activation of caspase-9 after being treated with different concentrations of celecoxib for different time; C: Activation of caspase-3 after being treated with celecoxib for 12 h.
Figure 9 Dose- and time-dependent effects of reduced phosphorylation of Akt (Thr308) on HepG2 cell (A), SMMC-7721 cell (B), BEL-7402 cell (C).
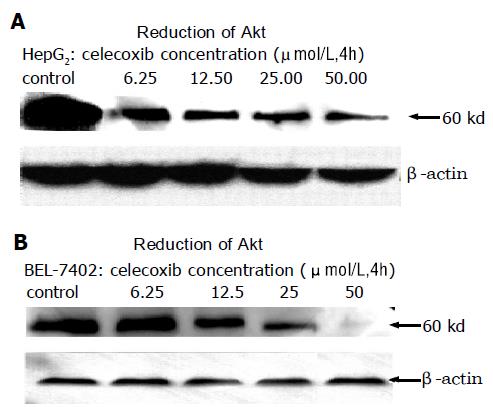
Figure 7 Dephosphorylation of Akt/PKB after treatment with celecoxib for 4 h.
A: HepG2 cell line; B: BEL-7402 cell line.
Figure 8 Down-regulation of phosphorylation of Akt Thr308 after treated with celecoxib.
A: Normal control; B: SMMC-7721 cell line; (C): Negative control.
- Citation: Liu NB, Peng T, Pan C, Yao YY, Shen B, Leng J. Overexpression of cyclooxygenase-2 in human HepG2, Bel-7402 and SMMC-7721 hepatoma cell lines and mechanism of cyclooxygenase-2 selective inhibitor celecoxib-induced cell growth inhibition and apoptosis. World J Gastroenterol 2005; 11(40): 6281-6287
- URL: https://www.wjgnet.com/1007-9327/full/v11/i40/6281.htm
- DOI: https://dx.doi.org/10.3748/wjg.v11.i40.6281


