Copyright
©2005 Baishideng Publishing Group Inc.
World J Gastroenterol. Jan 28, 2005; 11(4): 498-502
Published online Jan 28, 2005. doi: 10.3748/wjg.v11.i4.498
Published online Jan 28, 2005. doi: 10.3748/wjg.v11.i4.498
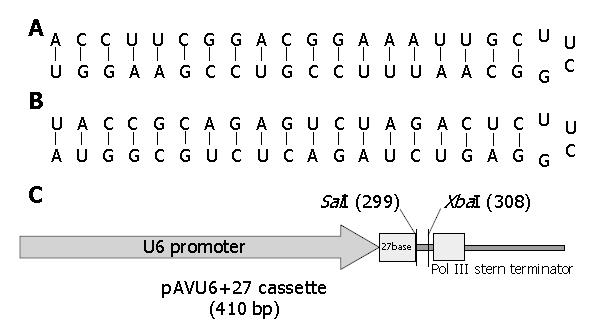
Figure 1 Structures of hairpins and U6 expression cassette.
A and B: Short-hairpin structures of pAVU6+4sh421 and pAVU6+4sh81, respectively. The loop was designed with TTCG. C: Map of pAVU6+27 U6 expression cassette including U6 promoter, the first 27 nucleotides of human U6 RNA, inserted fragments and polymerase III stem terminator.
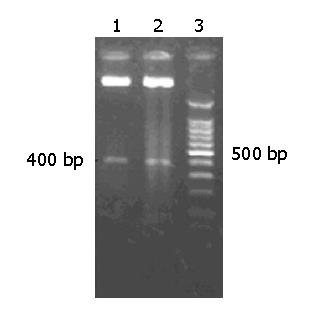
Figure 2 Electrophoresis analysis of digestion using BamH I.
Lanes 1 and 2: pHBS-GFP plasmid DNA; lane 3: DNA marker pHBS-GFP.
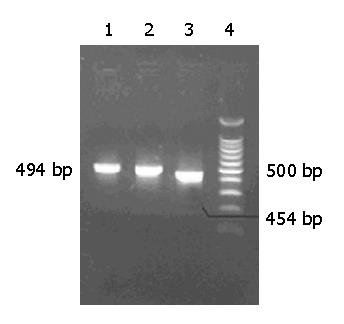
Figure 3 Electrophoresis analysis of PCR products.
Lane 1: pAVU6-4sh421 vector; lane 2: pAVU6-4sh81 vector; lane 3: pAVU6+27 vector; lane 4: DNA marker.
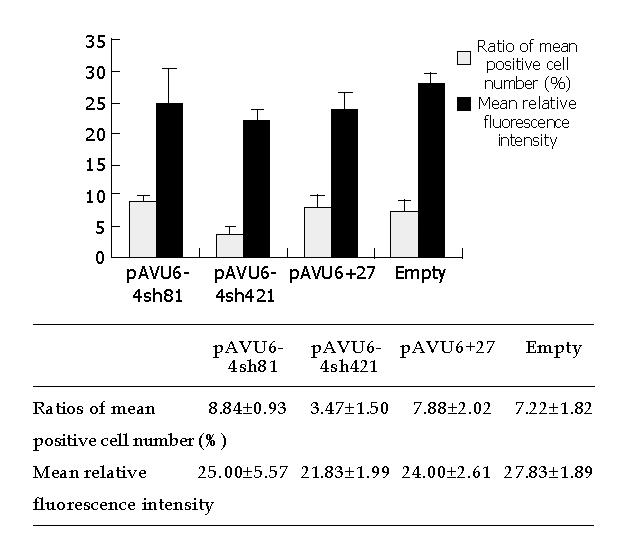
Figure 4 Flow cytometric detection of HBS-GFP fusion protein in HepG2 cells.
HepG2 cells were transfected with pAVU6+4sh421 and pAVU6+4sh81 vectors and analyzed by flow cytometry at 72 h post-cotransfection. The values obtained from three independent experiments were expressed as mean±SD.
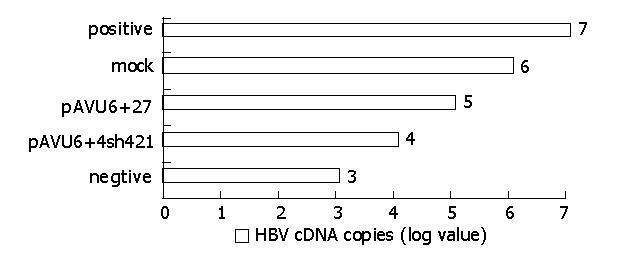
Figure 5 HBV cDNA copies detected by real time PCR analysis.
Data showed shRNA-mediated inhibition of expression of HBs-GFP gene. Positive, mock, and negative groups represented as pHBS-GFP DNA, cDNA of cells only transfected with pHBS-GFP, respectively.
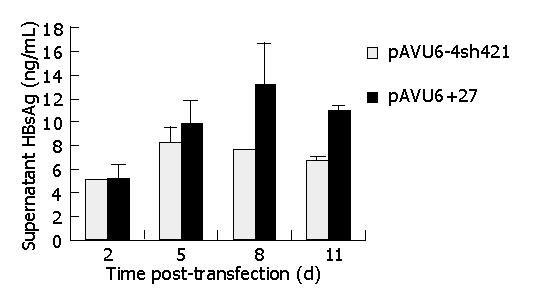
Figure 6 HBsAg concentration in the supernatant of shRNA-treated HepG2.
2.15 cells.
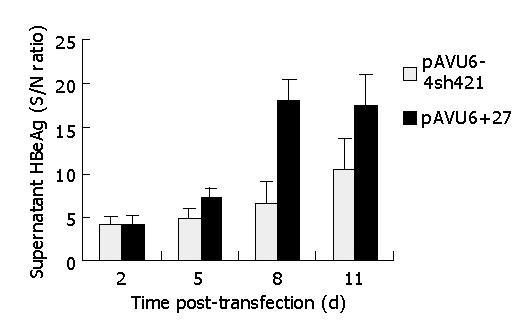
Figure 7 HBeAg concentration in the supernatant of shRNA-treated HepG2.
2.15 cells (S/N ratio, signal-to-noise ratio).
-
Citation: Yang ZG, Chen Z, Ni Q, Xu N, Shao JB, Yao HP. Inhibition of hepatitis B virus surface antigen expression by small hairpin RNA
in vitro . World J Gastroenterol 2005; 11(4): 498-502 - URL: https://www.wjgnet.com/1007-9327/full/v11/i4/498.htm
- DOI: https://dx.doi.org/10.3748/wjg.v11.i4.498


