Copyright
©The Author(s) 2005.
World J Gastroenterol. Oct 14, 2005; 11(38): 5997-6002
Published online Oct 14, 2005. doi: 10.3748/wjg.v11.i38.5997
Published online Oct 14, 2005. doi: 10.3748/wjg.v11.i38.5997
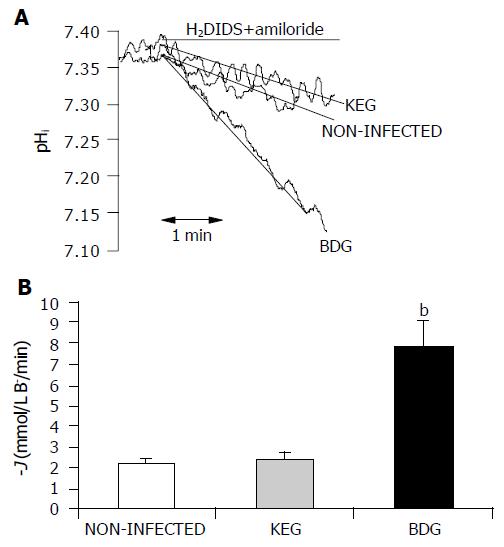
Figure 2 Inhibitor stop method for determining bicarbonate secretion.
A: Representative pHi traces; B: summary of the results obtained using the inhibitory stop method. bP<0.001 vs the control (ANOVA).
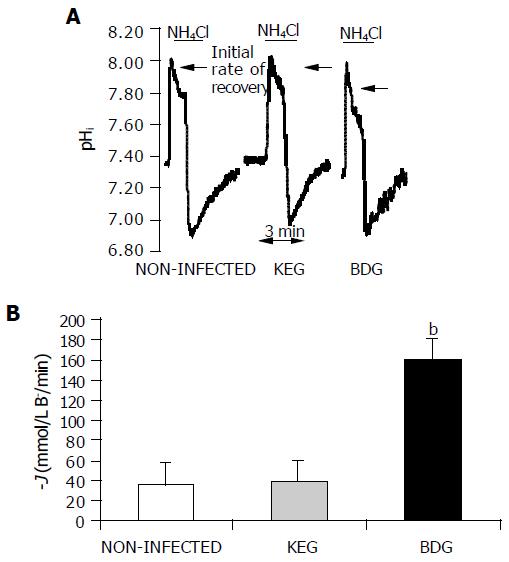
Figure 3 Alkali load method for determining bicarbonate secretion.
A: Representative pHi traces; B: summary of the results obtained using the alkali load method. bP<0.001 vs the control (ANOVA).
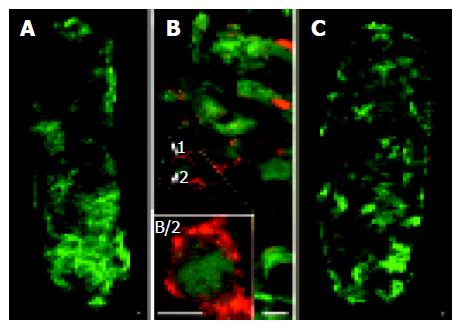
Figure 1 Infection of guinea pig pancreatic ducts with BDG and Ka-EP0lacgfp (KEG).
A: Infection of the pancreatic ductal epithelial cells with BDG; B: appearance of viral antigens indicating the productive BDG infection and GFP fluorescence; C: non-virulent KEG strain-produced high efficiency of infection. Scale bars represent 10 mm.
- Citation: Hegyi P, Ördög B, Jr ZR, Takács T, Lonovics J, Szabolcs A, Sári R, Tóth A, Papp JG, Kovács AVMK, Gray MA, Argent BE, Boldogköi Z. Effect of herpesvirus infection on pancreatic duct cell secretion. World J Gastroenterol 2005; 11(38): 5997-6002
- URL: https://www.wjgnet.com/1007-9327/full/v11/i38/5997.htm
- DOI: https://dx.doi.org/10.3748/wjg.v11.i38.5997


