Copyright
©The Author(s) 2005.
World J Gastroenterol. Oct 14, 2005; 11(38): 5951-5957
Published online Oct 14, 2005. doi: 10.3748/wjg.v11.i38.5951
Published online Oct 14, 2005. doi: 10.3748/wjg.v11.i38.5951
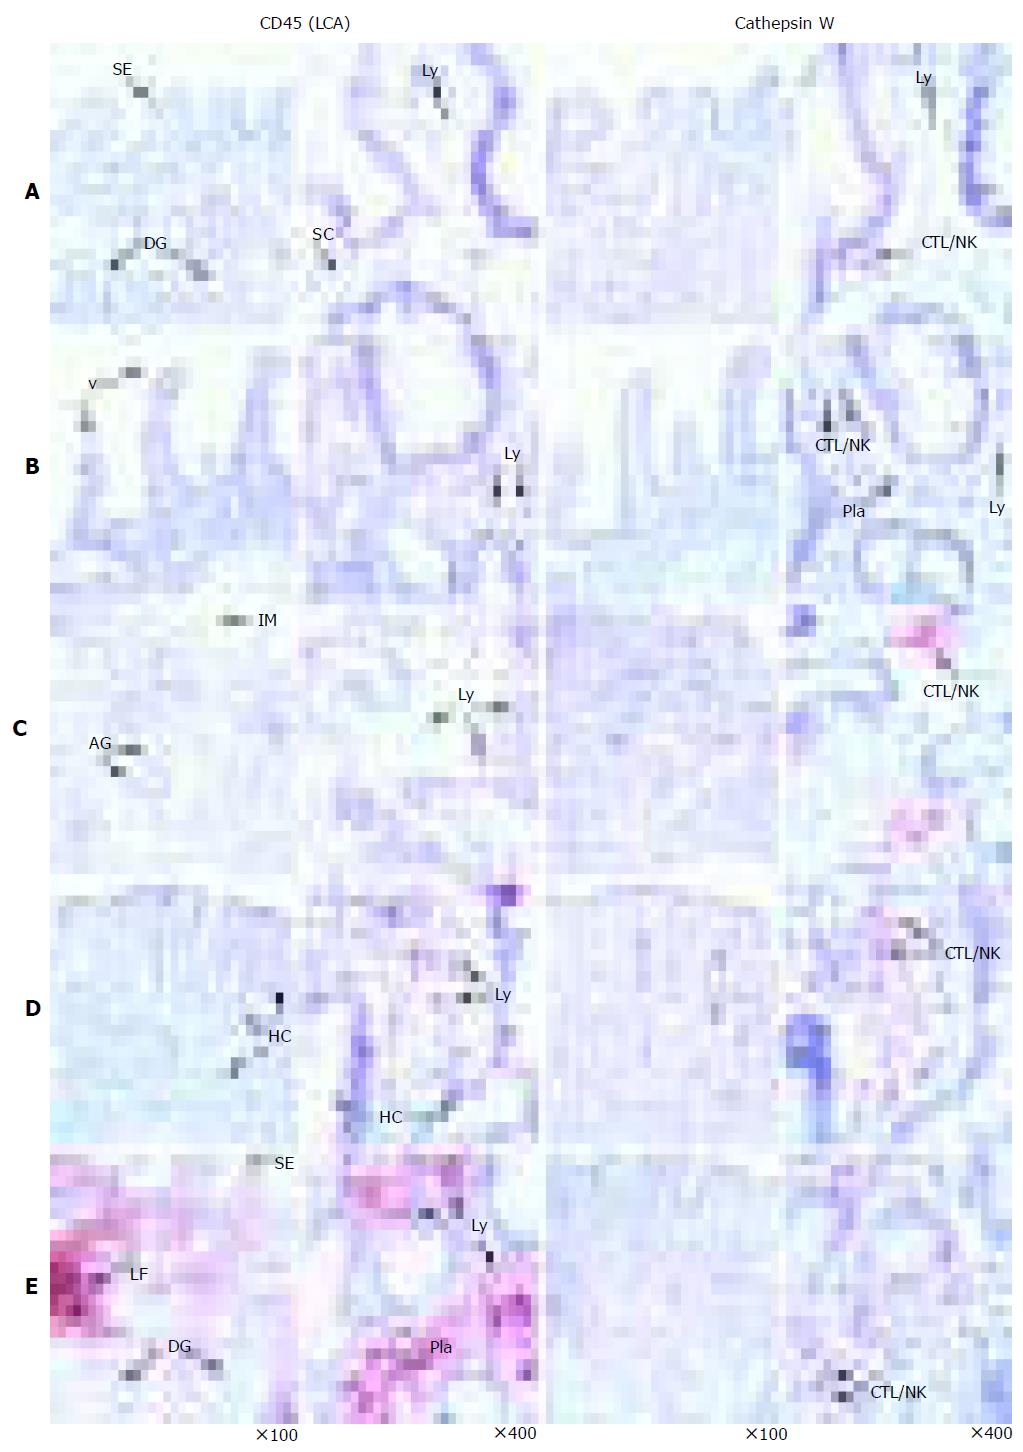
Figure 1 Immunohistochemical detection of CatW in gastrointestinal tissue specimens.
The cellular distribution of CatW expression is presented by red staining, whereas the nuclei are counterstained with hematoxylin (blue). The distribution of CD45 (LCA) is shown as brownish staining. The negative controls (using isotype controls) did not reveal any signals (not shown). The tissue samples were as follows: normal gastric mucosa (A), duodenum (B), AIG (C), CD (D) and H pylori gastritis (E). AG: Atrophic glands, CTL: cytotoxic T-lymphocyte, DG: deep gastric glands, HC: hyperplastic crypts, IM: intestinal metaplasia, LF: lymph follicle, Ly: lymphocyte, Pla: plasma cell, NK: natural killer cell, SC: stroma cells, SE: surface epithelium, T-Ly: T lymphocyte, and V: duodenal villi.
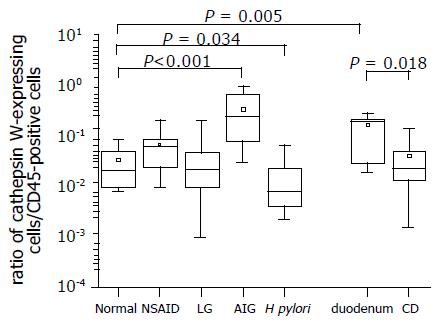
Figure 2 Presence of CatW-expressing cells among infiltrating immune cells in samples of patients with gastritis.
The distribution of CatW- and LCA (leukocyte common antigen, CD45)-expressing cells was separately analyzed by immunohistochemistry in serial sections of tissue specimens. The number of CD45-positive cells was considered as 100% presented as a ratio of 1 at the Y-axis. The ratio of CatW+/LCA+ cells illustrates the proportion of CatW-expressing cells among leukocytes present in the gastric/duodenal mucosa. Data are shown as box plot for each group (antral mucosa: normal; chemically induced gastritis: NSAID; lymphocytic gastritis: LG; autoimmune gastritis: AIG; H pylori-induced gastritis: H pylori; normal duodenum: duodenum; celiac disease: CD). Boxes represent the 25th, 50th, and 75th percentile values (horizontal lines of the box) and means (squares). Mean values of absolute numbers of CatW-expressing cells per observation field were 0.5, 4.1, 4.2, 10.7, and 41 for normal antral mucosa, H pylori gastritis, NSAID-associated gastritis, LG and AIG, respectively. Tissue specimens from normal duodenum revealed 16 CatW-expressing cells per field, while samples from patient with CD had 6.3 CatW-positive cells in average per field.
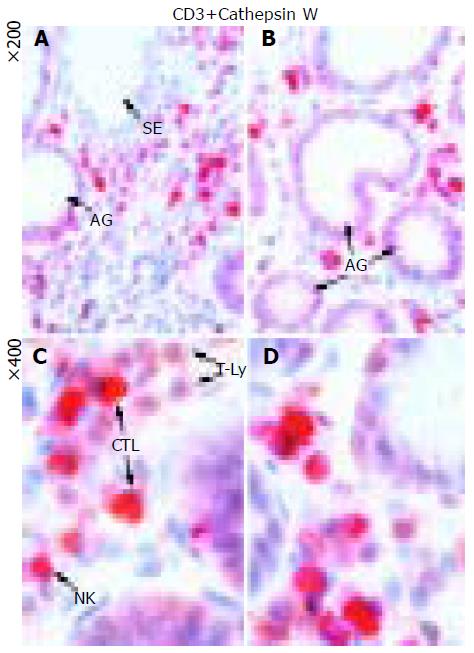
Figure 3 Detection of CatW and CD3+ T cells in tissue specimens of AIG.
The immunohistochemical double staining allowed a differentiation of both CatW-expressing cell types as well as a separation of CTLs from the other T cells (T-Ly) among the infiltrating cells of the lamina propria: Whereas CatW–/CD3+ positive T cells could be clearly distinguished by the brownish staining and were abundantly seen in the samples of AIG, an additional cytoplasmic red staining detected the CatW-expressing CTL. The exclusively red staining marked the CatW+ NK cells, which were only rarely spotted in the lamina propria.
- Citation: Kuester D, Vieth M, Peitz U, Kahl S, Stolte M, Roessner A, Weber E, Malfertheiner P, Wex T. Upregulation of cathepsin W-expressing T cells is specific for autoimmune atrophic gastritis compared to other types of chronic gastritis. World J Gastroenterol 2005; 11(38): 5951-5957
- URL: https://www.wjgnet.com/1007-9327/full/v11/i38/5951.htm
- DOI: https://dx.doi.org/10.3748/wjg.v11.i38.5951


