Copyright
©The Author(s) 2005.
World J Gastroenterol. Oct 14, 2005; 11(38): 5951-5957
Published online Oct 14, 2005. doi: 10.3748/wjg.v11.i38.5951
Published online Oct 14, 2005. doi: 10.3748/wjg.v11.i38.5951
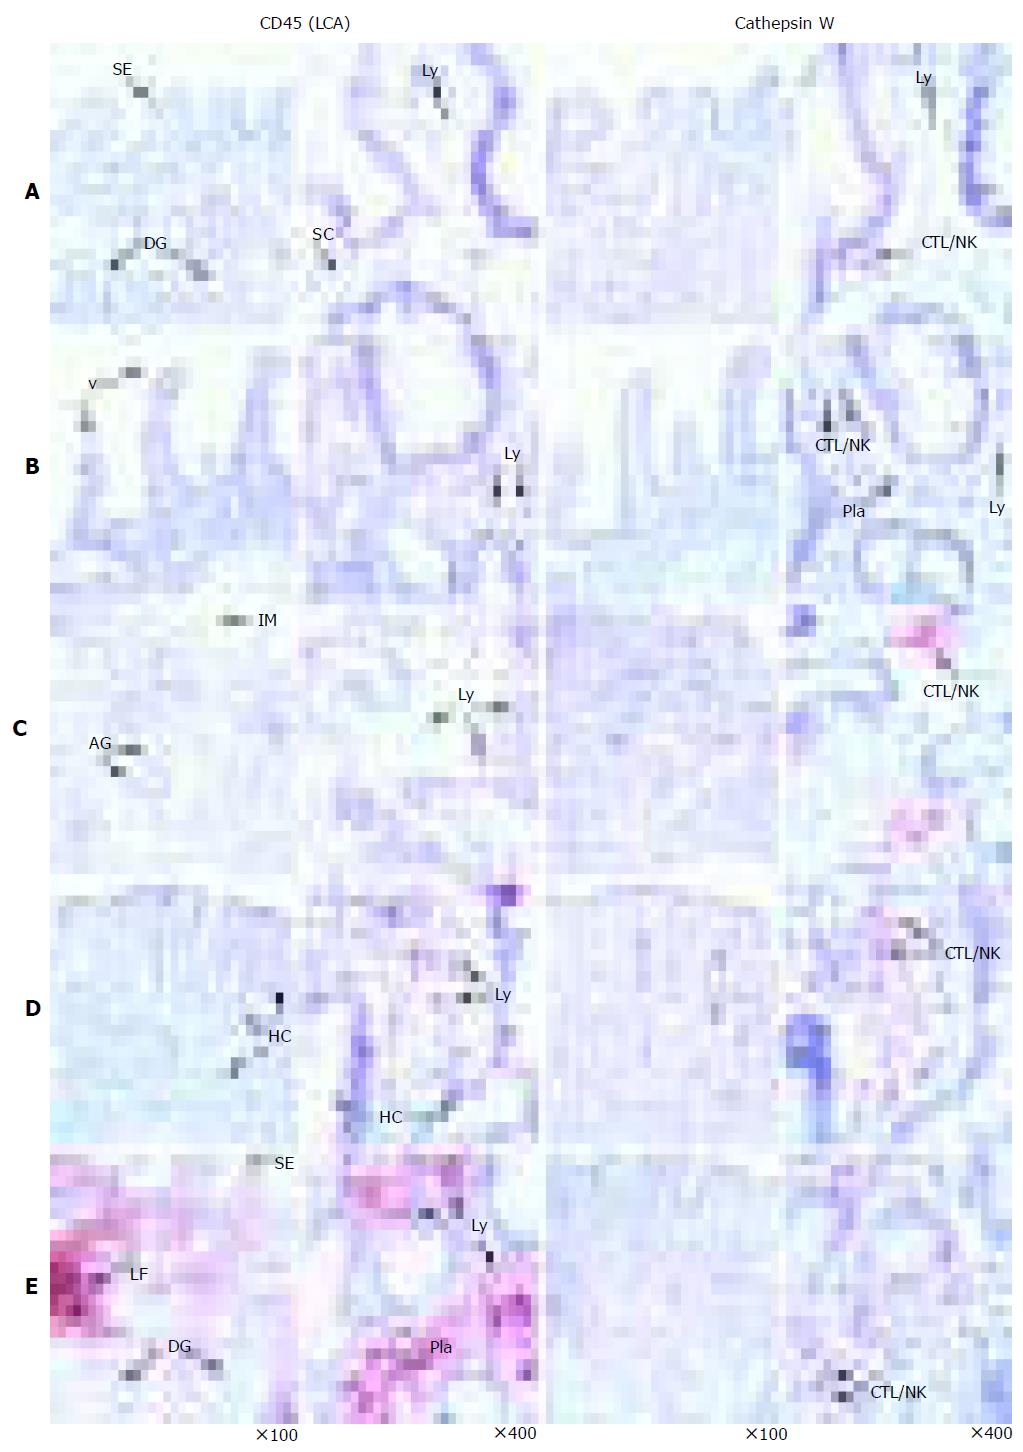
Figure 1 Immunohistochemical detection of CatW in gastrointestinal tissue specimens.
The cellular distribution of CatW expression is presented by red staining, whereas the nuclei are counterstained with hematoxylin (blue). The distribution of CD45 (LCA) is shown as brownish staining. The negative controls (using isotype controls) did not reveal any signals (not shown). The tissue samples were as follows: normal gastric mucosa (A), duodenum (B), AIG (C), CD (D) and H pylori gastritis (E). AG: Atrophic glands, CTL: cytotoxic T-lymphocyte, DG: deep gastric glands, HC: hyperplastic crypts, IM: intestinal metaplasia, LF: lymph follicle, Ly: lymphocyte, Pla: plasma cell, NK: natural killer cell, SC: stroma cells, SE: surface epithelium, T-Ly: T lymphocyte, and V: duodenal villi.
- Citation: Kuester D, Vieth M, Peitz U, Kahl S, Stolte M, Roessner A, Weber E, Malfertheiner P, Wex T. Upregulation of cathepsin W-expressing T cells is specific for autoimmune atrophic gastritis compared to other types of chronic gastritis. World J Gastroenterol 2005; 11(38): 5951-5957
- URL: https://www.wjgnet.com/1007-9327/full/v11/i38/5951.htm
- DOI: https://dx.doi.org/10.3748/wjg.v11.i38.5951


